
5 years of QE and the distributional effects

Big Al is donating his time this morning to a local food bank by helping pack Thanksgiving dinners. He will be back this afternoon but we will have Rick and Doc on this morning as always. In the meantime check out the interesting article linked below.
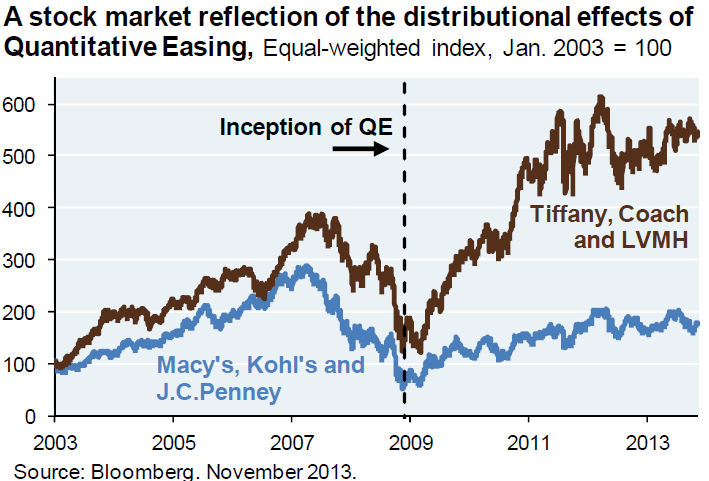
I found this link on Tim Iacono’s website. The article, which is posted at a site called Sober Look, takes a look at the so-called “distributional effects” of QE and QE related programs. The conclusion the author comes to, which was not a surprise to me was the following “It therefore shouldn’t be a surprise that the three rounds of quantitative easing over the past five years rewarded those who had the wherewithal to hold substantial equity investments. Everyone else on the other hand – which is the majority – was not as fortunate.” There are some great charts included in the article that are worth checking out. Especially the one I included below.
Click here to read the full article and check out all the supporting charts.
The numbers in trhe chart are in $billions per year.
Good for you Big AL!
I used to do things like that when I was younger and poorer; now I just make a donation and let others do the heavy lifting.
Locally Gleaners seems to make the best use of funds:
https://app.etapestry.com/hosted/Gleaners/OnlineGiving.html?__utma=1.195726015.1384970490.1384970490.1384970490.1&__utmb=1.2.10.1384970490&__utmc=1&__utmx=-&__utmz=1.1384970490.1.1.utmcsr=(direct)|utmccn=(direct)|utmcmd=(none)&__utmv=-&__utmk=211451797
I’m sure there are similar organizations in every state.
I think the best illustration of the redistribution effects of QE is given in this chart:
http://thefederalist.com/wp-content/uploads/2013/11/McKinsey-Exhibit-5.png