Christopher Aaron, Founder of iGold Advisor and Senior Editor at the Gold Eagle website, joins me to review his medium to longer-term technical outlook on gold, silver, the precious metals stocks, and the Dow:Gold ratio. Christopher lays out the sentiment and valuation indicators along with chart-based evidence that “This is it, and IT is now!”
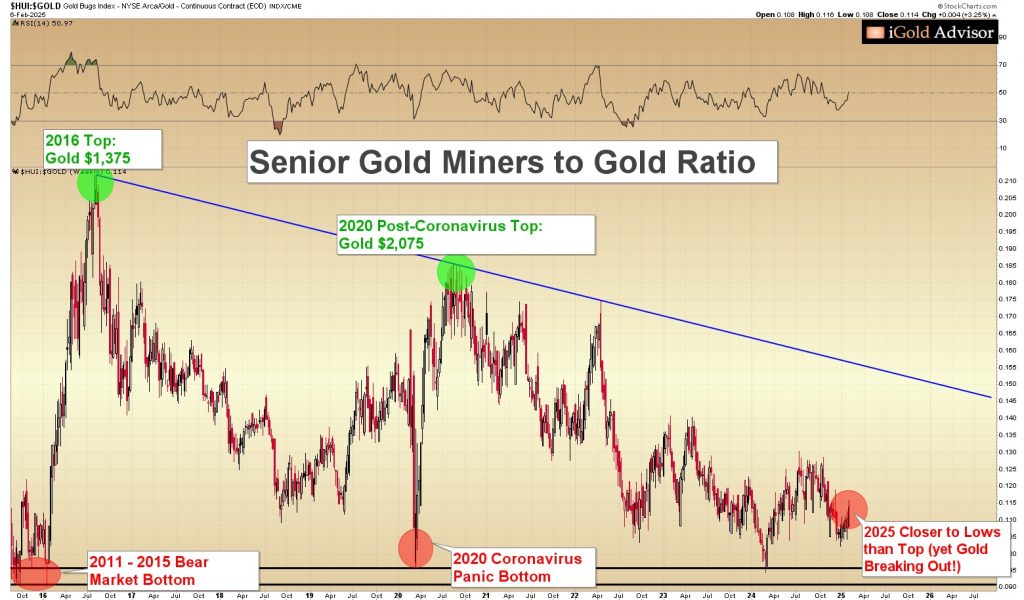
We start off reviewing unique juxtaposition of factors that are setting up into the probabilistic opportunity of a generation for the final wave higher in the precious metals complex. On one hand we have gold breaking out to new all-time highs again this week in dollar terms, after already breaking out in almost every other global currency, and then silver well back above the $30 level, back up above $32. And yet, on the other hand, we have very low valuations in gold and silver equities versus the underlying metals on a historical basis, paired with weak to muted participation from investors on resource websites, when tracking the readership of articles, newsletter writer subscriptions, and when analyzing search engine data on gold and silver. It is a glaring dichotomy.
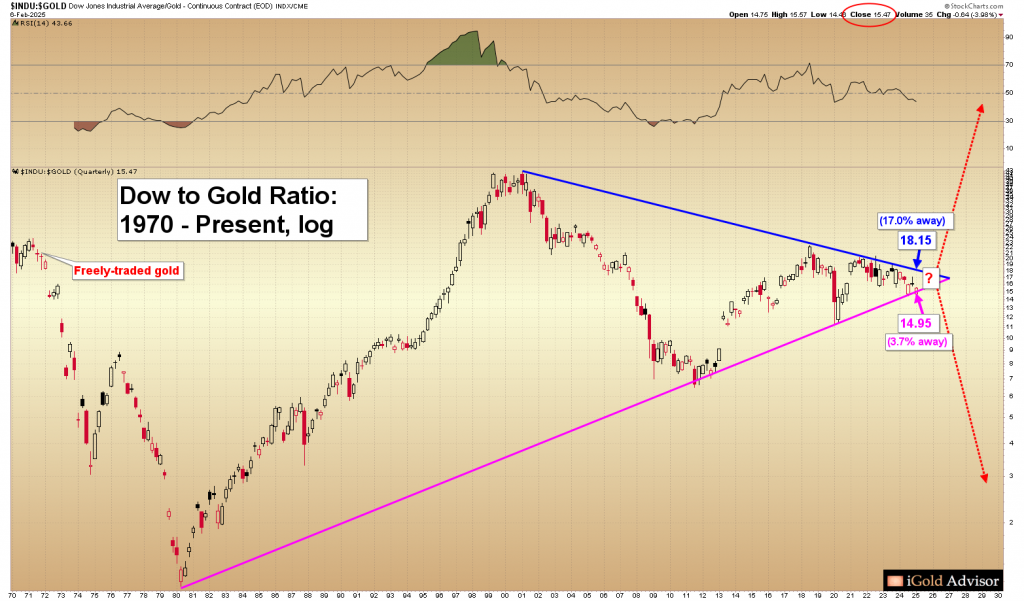
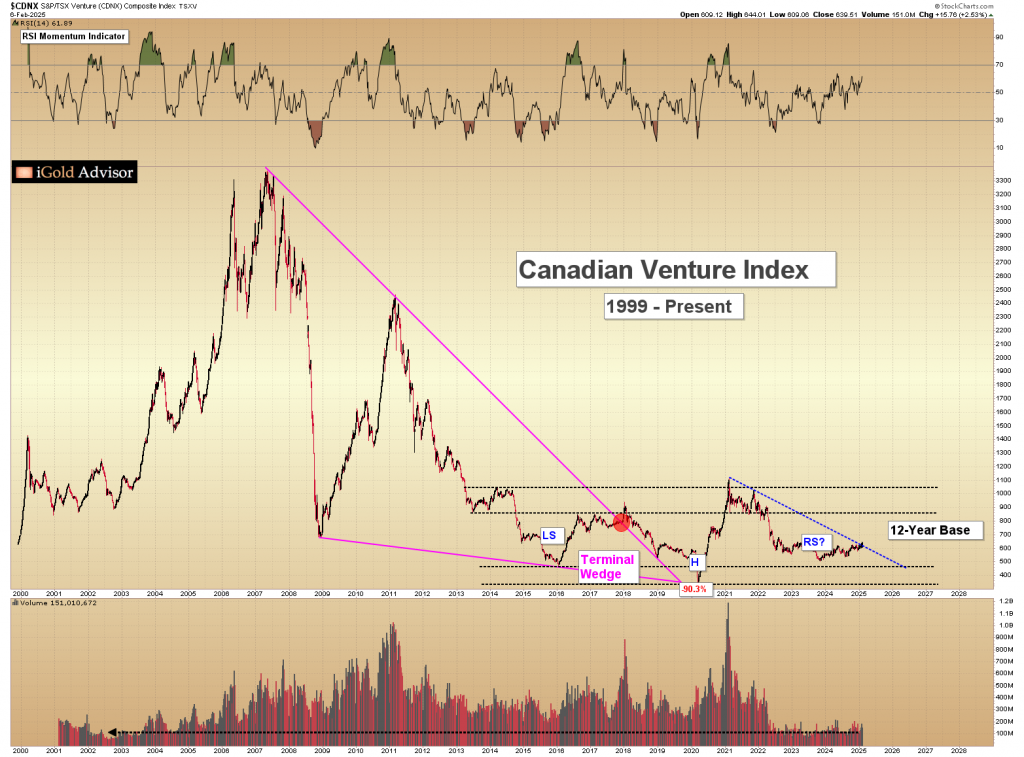
We review 3 key charts to unpack this moment in history more clearly analyzing the data seen on the HUI:Gold ratio chart (looking as the senior gold miners versus gold), the DOW:Gold ratio chart (looking as the US equities versus gold), and the Canadian Venture Index pricing and volume. We discuss the analog to the 15-month period of time between October 1978 – January 1980 when the last 10% of the move in the gold equated to 90% of the gains in gold and silver equities. For this reason, Christopher has doubled his exposure to precious metals mining stocks over the last few weeks, and believes that “This is it, and IT is now.”
.
Click here to visit the iGold Advisor website to keep up with Christopher’s market commentary.
.
Click here to follow Christopher’s writing over at the Gold Eagle website
.
.