
It’s nice to back with readers here for a big picture lay of the land. We’ll go around the horn here and look at the recent macroeconomic data, interest rates, the dollar, US general equities, and the commodities and energy markets and some of the key markets within them like oil, nat gas, uranium, gold, silver, copper, and more….
Macro Movers:
Wrapping up the last full week of January, we got 2 key pieces of economic data for the markets to munch on and digest:
- Higher than expected GDP growth at 3.3% for the 4th quarter, surprising to the upside, with most analysts anticipating something closer to 1.8%-2%. Diving under the hood, the areas that most impacted this Gross Domestic Product beat came from personal spending, focused mainly on services at 1.9%, and the consistent theme of government spending at 0.60%. Trade, exports, imports, and private investment made marginal contributions to round out the remaining growth.
- The PCE deflator headline reading came in steady at 2.6% year-over-year, and core came in at 2.9%, which was pretty much as expected. There was a slight bump up 0.2% month-over-month, but overall the trend on the inflation is continuing to head lower and moderate, and it is steadily moving closer to the Fed’s 2% target area.
Many market commentators are already posting charts and pointing out that the 3-month annualized and 6-month annualized inflation rates have already come down close to 2% level of inflation, and see a “mission accomplished” pat on the back to Powell and company as a foregone conclusion. However, one key question is how everyone at the pivot party will feel if we start seeing a few months where inflation starts ticking back higher?
With regards to the macroeconomic environment for last week, we’ve also seen a steady slide backwards in the timing and number of interest rate cut expectations for 2024 in the Fed funds futures markets, due to a string of better-than-expected economic data. The chorus of economists singing praise to the “soft landing” narrative grows ever louder. Looking at the epic moves higher in the general US equities lately, it appears that the main takeaway is that most market participants believe the worst economic headwinds are behind us.

Earlier this week David Rosenberg, President at Rosenberg Research & Associates, noted in an interview on the WSJ that: “The notion of a recession has been completely obliterated from the mind and the positioning of most portfolio managers. There is tremendous confidence in the soft landing—perhaps confidence that is now bordering on complacency.”
- Apparently, good times are here once again… But are they?
It still seems like a bizarre disconnect in the markets that they are still rallying after the Powell pivot, anticipating a series of rate cuts and lower interest rates this year; but there doesn’t seem to be any impetus on the horizon or something financial breaking that would necessitate these cuts. It also seems lost on the market that if the Fed was to seriously start cutting rates in a more meaningful way, that there would be something else going off the rails in the economy or markets, and so it seems like a strange thing to wish for in the first place.
None of it really adds up. The story month after month, and quarter after quarter, continues to be better economic conditions overall for GDP, inflation, the jobs market, retail spending, and it has all come in paired with a surging stock market that has been breaking out to new highs. With that backdrop then why in world would the Fed be in the slightest hurry to cut rates anytime soon?
With the wind at their backs, the central bankers would be best served to just ride out this goldilocks trend in the US economy and stock markets for a few more months with no change to rates. There aren’t really any pressing concerns that require them to backstop jilted markets, and there seems to be little fear in the markets at all, as evidenced by a S&P VIX reading coming in 13.26. So again, what is the rush in cutting?
If history is our guide, then the Fed has always erred on the side of being much more reactionary than proactive in prior cycles. Even more recently in late 2021 and early 2022 they quipped that they were “not even thinking about… thinking about, cutting rates until 2023;” only to before forced to expedite their bond tapering program in early 2022 and shift to cutting rates a full year before they messaged they’d even need to consider it. That’s the Fed we know… consistently “behind the curve.”
However, the fly in the ointment here is the problem hiding in plain sight — rising inflation-adjusted “real rates.” We still have a Fed funds rate of 5.25%-5.5% and yet inflation, according to the flawed government statistics we are all forced to stomach, is now down near 3% on CPI and closer to 2% on the 3-month and 6-month annualized PCE deflator data. That is a very large delta between the two inputs, and thus the trend for a number of months has been rising real rates… and that is going to increasingly become a problem.


Even if one uses the 10-year yield (around 4.14% on Friday of last week) instead of the Fed funds rate, and then we subtract the range of 2%-3% inflation, then we still find the USA economy in an environment of positive real rates (something we’ve not seen in over 3 years). Positive real rates are typically what we see near market tops, and normally they brutalize the precious metals far worse than they actually have all things considered. If the central banks start cutting rates and take real rates back into negative territory, then it will be curious to see if market participants remain as complacent as they have been.
Could it be that Powell and company decide that “this time is different” and it may behoove them to actually be proactive? Is it possible that the Fed decides that maybe they should start cutting rates by 25 basis points in March, just to narrow that gulf between interest rates and much lower inflation levels? It’s a theory some economists and market watchers are pondering.
Look nobody expects them to make any changes this next week on Wednesday at the Jan. 31st FOMC meeting. What will really dictate how the market moves towards the end of next week will be the Powell press conference afterwards and what signal they give for the potential of a small cut at the March meeting (along with any potential fireworks out of the coming jobs data at week’s end. But again, as far as the FOMC, most are expecting a nothing burger in January for policy action. However, everyone will be listening, reading, and parsing the Fedspeak this next week for the look forward, and that is one of the key macro movers for the weeks and months to come.
- It is actually quite startling to consider that if we just back up the clock a month and half into early December, that the prospect of a March rate was something everyone assured us had a 90%-100% chance and was a done deal. Now a March rate cut has drifted down into the 47% range and falling, and the market has shifted it’s bet with regards to Fed funds futures to around 50% odds that they hold out until the May FOMC meeting before doing any cutting to the rates. Honestly, it’s a bit silly that people believe that they have any certainty at all for something 3-5 months out… but that is the market we are in.
It will be curious in this week’s meeting and presser if the central bankers even acknowledge the spread between the Fed Funds rate and the bond yields, or the even bigger growing spread between their rate and the inflation rate. Something’s got to give here in the not-too-distant future, with real inflation-adjusted rates creeping higher and higher, and it’s quite possible the Fed’s monetary policy has become overly restrictive.
Aside from the dichotomy between the Fed funds rate and inflation going into this weeks Fed meeting, all eyes (including Powell’s) will also be on the incoming labor market and jobs data. This will be a particularly busy week which will include JOLTS, ADP, the Employment Cost Index, weekly jobless claims, and the monthly nonfarm payroll report. More so that the Fed meeting, I see the jobs and labor market data as being more of a wildcard, and as more comes in, we’ll likely see some whipsaw markets, culminating in the NFP report data on Friday. Never a dull moment…
- Helping us to make sense of it all, over at the KE Report last Friday we interviewed Marc Chandler, Managing Partner at Bannockburn Global ForEx and Editor of Marc To Market.
Marc Chandler – Inflation and GDP Recap; What Higher For Longer Means For Markets

——————————————————————————————————————-
Interest Rates:
Treasury yields are a mixed bag with the yield curve between the 10-year and 2-year yields compressing and flattening a bit more. Last week we saw the 10-year bond yield bounce off a short-term weekly low around 4.07% to close the week pretty close to 4.14%. Conversely the 2-year yield came down off a weekly high of 4.41% to head down to 4.35% at the end of last week. To kick off the week on Monday the 10-year moved down to 4.108% and the 2-year moved down 4.328%. For the last few trading sessions there has been only a 21-22 basis point spread between the “10 and the 2” and that is one of the more narrow delta’s we’ve seen in the last year and a half.
As noted in previous articles, when we see that at parity show up in short and long end of the curve, and when the yield curve starts to steepen in favor of the long-end of the curve, that is the point historically where we see economic data start contracting and can mark a top in market ebullience. Those tracking the potential of recession in 2024 (admittedly a much smaller group than a year ago) are watching the yield curve for this normalization and steepening event as this year unfolds. Those that assume we’ve had a soft landing, have conveniently quit noticing this aspect of the yield curve, noting that this time is different.
——————————————————————————————————–
US Dollar may be muted to weak:
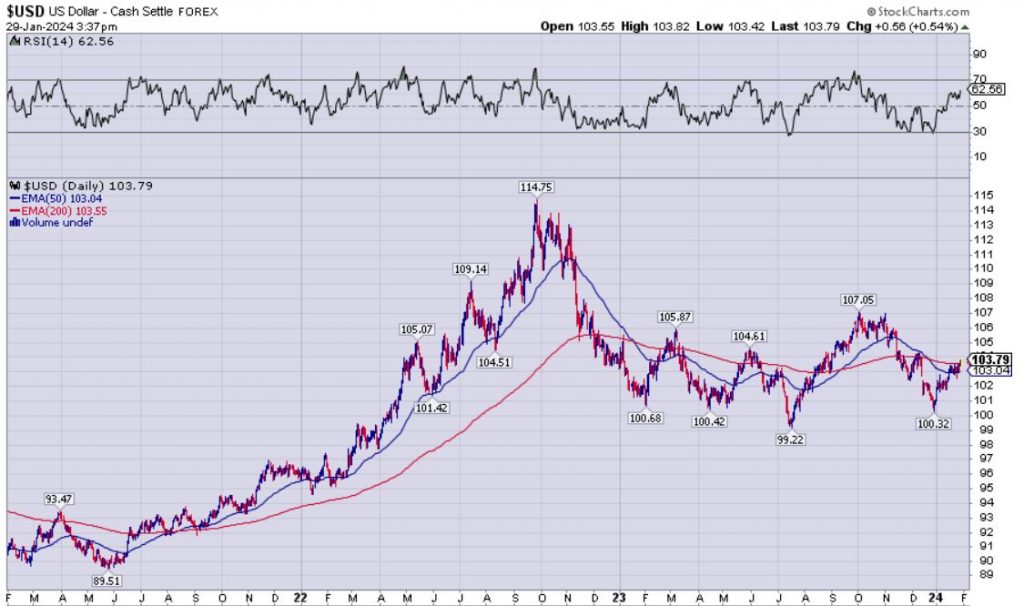
Most market platforms have shifted over to the March futures contract for the US dollar where it settled on Friday at around 103.24, and gapped up earlier Monday to open at 103.31 and surged up to 103.60. This brings the futures price up closer to the cash settle price, where on Friday to end last week the Forex cash settlement price was103.79. Not really a surprise to see the futures prices playing catch up.
What we can say in looking at the greenback is that there is a lot of congestion in this area of the mid-103’s. The 50 day Exponential Moving Average (EMA) comes in at 103.04, and the 200 day EMA comes in at 103.55 on the cash settle pricing. The action in the US dollar on Friday to close last week, and on Monday to open up this week is that it has briefly lifted a bit higher, possibly nearing the end of bullish run that saw it bottom a couple of weeks back at 100.32. It is going to be interesting to watch how the buck moves mid-week based on the Fedspeak, but if it keeps strengthening, then it start to become a headwind to markets and commodities.

This week we also get the eurozone’s Q4 GDP, and whether or not they can break out of their funk and stagnation. The outlook is for a further reduction in growth, and this has weighed on the euro, which is the largest currency counterbalanced against the greenback in the DXY dollar index, sending the dollar higher in relation. I
——————————————————————————————————————
US General Equity Markets Are Narrowing In Breadth Once Again
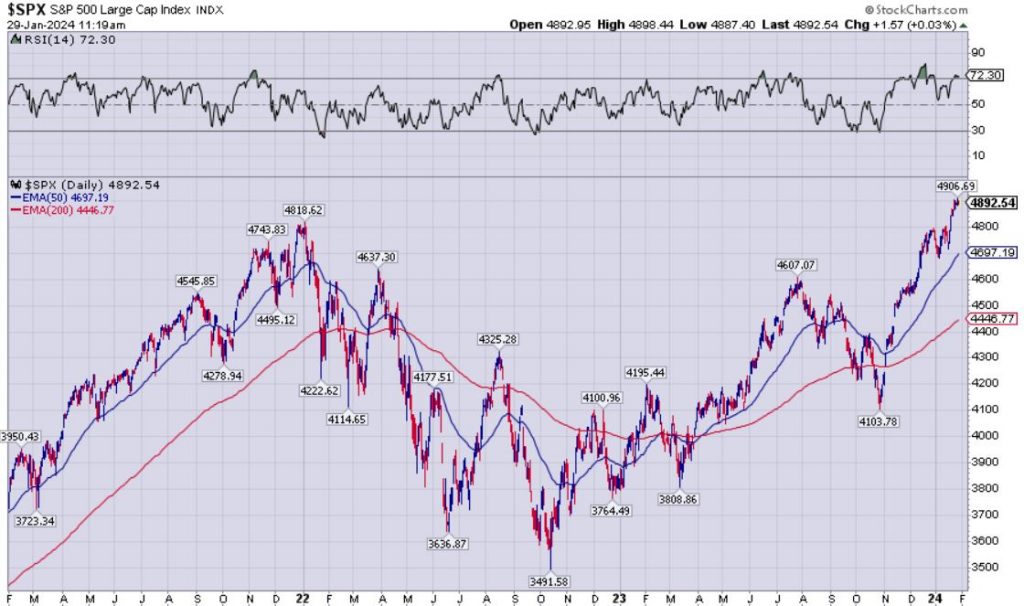
The Dow, Nasdaq, and S&P 500 have been up at record levels for the first time in two years, but we’ve seen the market breadth narrowing, with the small caps in the Russell 2000 having a harder time finding their footing (still about 20% off from their November 2021 peak). Once again, Information Technology (big Tech) is the only one of the index’s sectors that is really seeing that massive support and volume from market participants. The other 10 sector SPDR ETFs in the S&P 500 are trading an average of 15% below their all-time highs.
With everyone piled back into the big-boys and Magnificent 7 once again, the risk of a heavyweight tumble back to the downside would be quite problematic for the weighted S&P 500 index. The equal-weighted S&P 500, which gives the same status to the smallest and largest companies in the index, is down 0.3% this year. This is a big week during earnings season for some of the mega-cap tech stocks including Microsoft, Meta and Amazon, so their reports and more importantly guidance could provide further insight into whether the market’s gains can be sustained.
We also have an election year in 2024, which tends to be a bullish year for general equities. Another data point I read recently that caught my attention was that, according to ClearBridge Investments, “In the previous 14 instances when the S&P 500 set a new all-time high for the first time in more than a year, the rally continued over the following year more than 90% of the time with an average return of 13.9%, with one outlier in mid-2007.”
Regardless of what data one looks at, it is hard to ignore the bullish stance the markets have been in since bottoming in October of last year, and new vigor seen since the December Pivot Party. There was a brief hangover to start out 2024, and it is a bit concerning to see the narrowing breadth and smallcaps more muted, but we’ll need to see if Big Tech can keep carrying the day post the next 2 weeks of earnings, the FOMC meeting mid-week, and all the jobs data we’ll get hit with over the balance of the week to come.
- Last week, over at the KE Report, we had a good discussion with Joel Eleconin, Co-Host of the Benzinga PreMarket Prep Show, where he discussed this piling back in of investors into the mega-cap tech stocks:
Joel Elconin – A Tale Of 2 Markets, Tech/AI vs Everything Else
—————————————————————————————————————-
Commodities:
With regards to commodities, we’ll discuss the monetary metals of gold and silver, the key indicator of economic health with Dr copper, and we’ll look at the energy sector with oil, natural gas, and uranium.
Gold:
Not really much to say here for the “yellow metal” this last week, other than once again it marked more time above the critical psychological level of $2000 for another week, closing on Friday at $2017. Gold still remains well above it’s 200 day EMA (currently at $1969.43), but had recently dipped below it’s 50 day EMA (currently at $2022.49) before opening up this week with the futures contract rolling over to the April contract and seeing it blast up into the mid $2040’s, despite the stronger dollar.

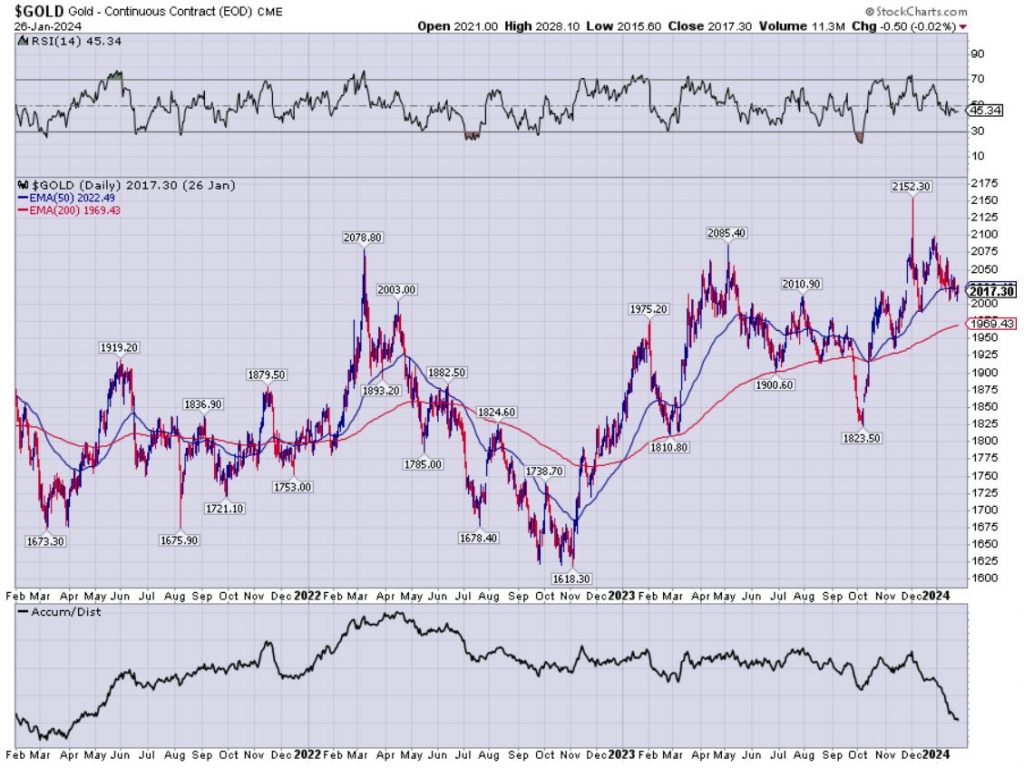
The fall in interest rates has had much more of impact on gold’s pricing lately than currencies, and Fed rate cut expectations from the market have played their part as well.
- This point was a main feature of our interview over at the KE Report last week with Craig Hemke, where he pointed out the tick-for-tick tracking with Fed funds futures.
Craig Hemke – Fed Rate Cut Expectations Continue Moving Gold, Yet Silver Still Follows The Dollar

We also got additional thoughts on both gold and silver and the precious metals mining stocks from friend of the KE Report show, and editor of the Junior Mining Junky, Dave Efle.
Dave Erfle – Inflation and GDP Recap, Miners Production Reports, GDX, GDXJ and Silver Technicals

——————————————————————————————————————-
Dr Copper:
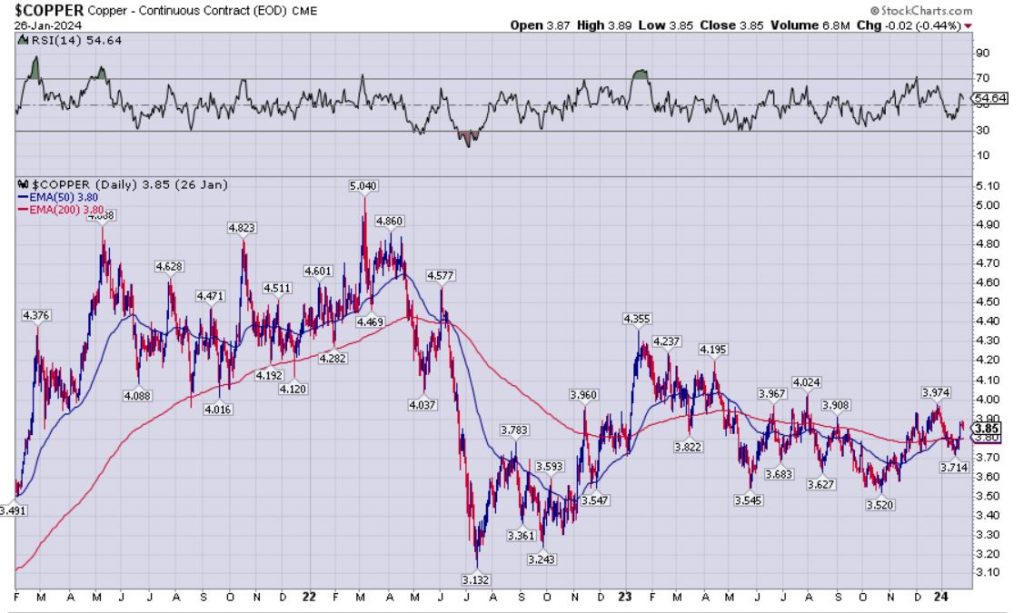
Copper has been stuck in a tug-o-war between bears and bulls, supply and demand, recession fears versus soft landing fanatics, and speculation on either side of the health of the Chinese economy, and the global engine of manufacturing.
Despite many commodity investors being table pounding bullish on the red metal the last 2-3 years, ever since copper topped out in pricing at $5.04, it has never come close to those levels again, and has mostly corrected down and then channeled sideways in a very sloppy whipsaw range. You can see on the chart below that both the 50 day EMA and 200 day EMA are at the exact same spot of $3.80, and copper closed last week only marginally above those levels at $3.85.

Last week closed up the kick-off of resource stock sector in Vancouver, Canada, and there were no shortage of big calls, once again, for copper being a metal to be in, and for the copper stocks to be in high demand as the supply/demand imbalances become even more acute. While this has been the message for a number of years in a row at resource conferences, we can hope that 2024 will be the year where this sector finally gets moving.


“The Only Two Metals You Need” (hint: gold and copper)
Robert Sinn (Goldfinger) presents at Metals Investor Forum | January 2024

——————————————————————————————————————-
Let’s Wrap Up Here With The Energy Sector
With regards to Oil, it is such a complex market with so many different fundamental inputs from inventory builds/decreases, to OPEC+ messaging versus reality, to geopolitical turmoil, issues in the Red Sea, higher than anticipated production from the US and some Middle Eastern countries, and a bevy of other inputs, I’m not going to belabor the point here….
Look Oil has been bouncing around in the low to mid $70’s for some time now, and other than that run above $90 a few months back has been mostly basing and consolidating looking for a direction. There are a fairly even amount of bears and bulls on both sides of this trades, giving their rationale for $50-$60 oil prices, or $80-$90 oil prices respectively.
What we can say is that oil is the $70’s is just status quo, not just for investors, but for companies that have used these price assumptions in much of their forward guidance and hedge books. For the 2nd half of 2023 and to start 2024 oil has been a big yawn overall, but it’s likely we are going to see it break out of the range it’s been in one way or the other in the medium-term.
- We reached out to Josef Schachter, Founder of the Schachter Energy Report, for an interview that aired on our weekend show at the KE Report, where we take a deep dive into oil, natural gas, and the related energy stocks. He does a fantastic job of laying out his bullish thesis for the balance of 2024 in the 2nd half of the show.
Weekend Show – Mike Larson & Josef Schachter: US Markets, Bitcoin, Gold, Copper, Oil and Natural Gas

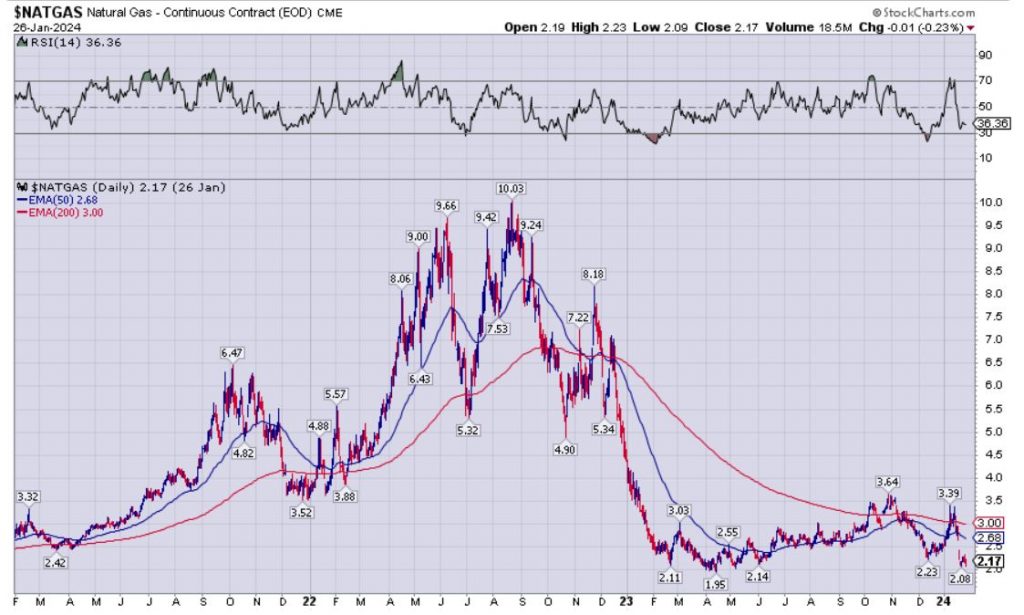
Joseph is clearly more bullish on Natural Gas, and the nat gas stocks, and this is the area of the market I see the most speculation in and receive the most questions about from resource investors. When one looks at the nat gas chart, it is easy to dream of what would happen if we blasted up out of the $2.17 area where it closed last Friday, and headed into the $3-$5 range by year-end. This is always a very volatile market though, and isn’t named the “widow-maker” amongst traders for nothing.

—————————————————————————————————————–
Uranium
What else can really be said about Uranium, other than it’s been in a solid bull market for years now, coming out of the March 2020 pandemic lows. It remains the talk of the resource stocks space, and at the conventions, was referenced over and over again as the standout sector in commodities, and in the related uranium stocks. I’ve been a Uranium bull for many years now, and have been thrilled with returns in the U-stocks in that big run from 2020-2021, and the run we just saw in 2023-through present.
I attended a Uranium mixer with 8 companies present at the end of the Vancouver Resource Investor Conference and the mood and sentiment ranged between celebratory and jubilation to greed and calls for $200-$400 uranium as things continue to unfold. Needless to say with everyone glad-handing, and patting one another on the back, it does reek of frothiness that needs to get rung out, so I trimmed just a little bit more back off a few positions last week. With Uranium spot pricing hitting $106 last week, it is definitely reason to take notice of the sector (with the all-time high being in the $138-$140 area). It crossed my mind that if investors were this excited at these levels, we’d have to superglue their feet to floor if uranium got up to $200 or $400 as many were pontificating. Still, it’s nice to see some excitement in one area of the resource stocks, and it is reminiscent of the excitement we saw in lithium stocks in 2021-2022, and oil stocks over those same 2 years.
I’ll likely have more to say on this sector in the weeks and months to come, but for now would point readers back to article I penned a few weeks back that summarized my thoughts, the history of how this bull market built up energy and has unfolded, and a number of charts on individual uranium stocks held in my portfolio.
We’ve Already Seen 10-Baggers And 20-Baggers In Uranium Stocks – Is There More Juice To Squeeze?
https://excelsiorprosperity.substack.com/p/weve-already-seen-10-baggers-and
Thanks again for reading this week’s article, and stay tuned for Part 4 of the series “Opportunities In Growth-Oriented Gold Producers” in the next few days.
> Also if you haven’t come over to subscribe to my Substack channel then please do so here:
https://excelsiorprosperity.substack.com/
Ever Upward!
- Shad