Excelsior’s Week In Review – Part 6 Inflation, Fed Policy Expectations, Interest Rates, Oil, Nat Gas, Uranium, Gold, Silver, Copper
In this article we’ll look back at the macroeconomic movers the 2nd week in January, and along the journey integrate points from some key interviews with special guests on the KE Report from throughout the week. We will also get into the commodities sector, with trends in the energy sector with regards to oil, nat gas, and uranium. Then we’ll move over to gold, silver, copper and the resource stocks. All of this as we wrap up the long 3-day weekend in the US (with markets closed on Monday for the MLK day holiday).
From a macro-movers narrative in the financial sphere last week, most of the commentary and action was packed into the latter part of the week, centered around the CPI and PPI inflation readings. This of course tied into the anticipated future moves in Fed policy, how that will affect general equities, bonds and interest rates. Another key economic input, the US dollar, was mostly flat on the week, despite some geopolitical flare-ups in Yemen, but both the greenback and gold were up mildly on Friday.
US Inflation Readings: One metric is up, One metric is down, Who cares?
The U.S. consumer inflation CPI report for December circulated on Thursday, coming in just a little hotter than anticipated. The headline US inflation number bumped up to 3.4% on an annual basis in December, from a 3.1% in November, and more than the 3.2% rate that was expected for last month. Regardless off the bump higher in CPI inflation for the December read; from a larger perspective, overall these CPI readings have declined as a major trend, from the 9.1% peak inflation reading that we saw a year ago.
Core CPI, sans food and energy, dropped from 4.0% down to 3.9%, but still 1/10 of a point higher than expected at 3.8%. Again, just like with headline inflation, the key takeaway was that core inflation continued to trend lower, even if it remained a bit higher and stickier than anticipated.
According to data released Friday by the Bureau of Labor Statistics, it showed that wholesale inflation measured in the headline PPI (Producer Price Index) rose by 1% annually in December. This demonstrated PPI has been slowing it’s roll and has been falling for 3 straight months in row. The core rate of PPI inflation remained essentially flat from the prior month.
Diving into a few key segments: The headline wholesale prices were up 1%, while core (taking out food & energy) was up 1.8% . Goods prices fell due to a larger drop in fuel/energy (diesel in particular) and food prices came down by nearly a percent over November. As for services prices were overall flat, when including the fall in transportation, warehousing and trade.
- So CPI came in a little hotter and was up, while PPI came in a little cooler and was down. So did the markets even care?
It seemed like a rather muted reaction by the US general equity markets, bonds, or commodities to these inflation readings, with the typical short-term volatility on hourly charts, but overall no real fireworks to report on. Friday ended up being a very subdued trading session, and the market that seemed to get the most love from the middle to end of the week was gold. Even there, not a big bid in the yellow metal, and some of that move may have also been tied to the geopolitical conflicts and news out of Yemen.
The main takeaway in markets, after digesting both Thursday’s CPI readings and Friday’s PPI readings on inflation, was the belief that the Federal Reserve is still on track to start cutting interest rates multiple times for the balance of this year. Fed Funds Futures at one point Thursday increased the speculation of central bank rate cut up to 80%, before dropping a bit into a range of 70%-75% on Friday, by the time we arrive at the 2nd FOMC meeting of this year March 19th-20th. Most market participants find it unlikely that the Fed will change anything for the upcoming Federal Open Market Committee meeting on January 30th-31st.
Interest Rates:
The 2-year bond yield was down 20 basis points on the week, closing at 4.146%. This 2-year yield is generally associated with the market view of where the Fed Funds rate is going to head. With a Fed funds rate of 5.25%-5.25% at present, it is easy to see the case for more rate cuts in 2024 to narrow the spread between that rate an the 2-year bond yield down closer to 4%.
The widely followed 10-year bond yield closed the week at 3.96%. This rate factor is key input into many high-frequency trading algorithms, and it remains something to keep a close eye on, as a counterbalance to many of the moves in a wide range of markets.
- What Happens When The Yield Curve Inversion Flattens Back Out?
The yield curve remains inverted, where the short end of the curve has higher rates than the longer end of the curve. We’ve been discussing this for a long time, as this setup has persisted for over a year now. While some have become lulled into a state of slumber or ambivalence, with regards to this unusual set up in yields spreads, there are still many economists that see this inverted yield cures as a signal that eventually a recession will come.
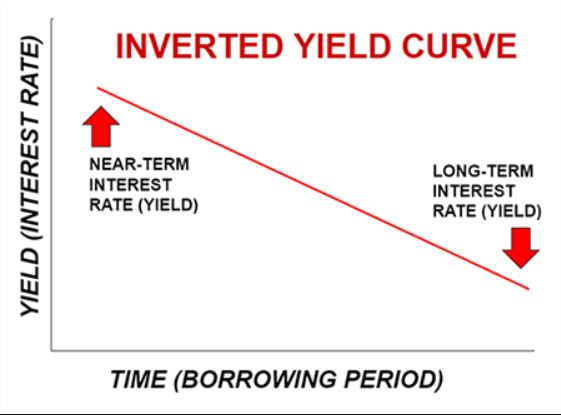
Having noted that pernicious belief, most of the research on inverted yield curves and recessions that has come across my desk, along with many data points our guests on the KE Report have raised during our interviews, demonstrate that it is actually the unwinding of this inversion that is pertinent to watch for. So it is really the flattening of the yield curve, when the long-end steepens to higher rates over the short-term rates, that is the actual trigger for a slowing economy and the bat signal for recession.
_____________________________________________________________________________________________________________
Peter Boockvar, friend of the show (and a good follow on Substack under The Boock Report), discussed with his free subscribers earlier this week the potential effects of the Fed finally starting to wrap up their Quantitative Tightening (QT) program. This was paired with the coming unknown impact from another message circulated by the central back about the conclusion of the emergency Bank Term Funding Program. The BTFP is set to wrap up by March. Peter summed up both situations concisely as follows:
- Flying under the radar of the discussion on when/how much will the Fed cut rates this year and what is the fate of QT, we’ve heard over the past few days from two Fed members that the Bank Term Funding Program is going to be retired on schedule on March 11th. Speaking at an event yesterday Fed Vice Chair for Supervision Michael Barr said the BTFP “worked as intended” and that it “really was established as an emergency program,” implying that the emergency is over and thus this program should be as well.
- Michelle Bowman in her speech Monday said, after talking about the creation of the BTFP in the wake of the major bank failures, “It is important to note that the Bank Term Funding Program is scheduled to expire in mid March of this year.”
- I’ll add this to my January 2nd list of big trade-offs. It is good news that an emergency liquidity program is ending but on the other hand, a crutch for many banks is going away. One that totaled $141b in the week ended 1/3/24, a fresh high.
- Peter Boockvar – Jan 10, 2024
- https://open.substack.com/pub/peterboockvar/p/another-big-time-trade-offsome-company
__________________________________________________________________________________________________________
On Thursday we dove into all these topics with Craig Hemke, founder and editor of TF metals report. He helped us sift through all the economic implications of the inflation readings last week and how that continued to factor into Fed policy expectations. We also had Craig highlight some of the areas between last year and this year’s “Macrocast” that he pens each January as an annual economic outlook. We get into what topics played out, and which topics or catalysts overlapped or were still in play between 2023 and 2024. This led to one of the main topics still in play being the what the implications could be of the Fed wrapping up the emergency Bank Term Funding Program (often referred to as a “Reverse Repo” short-term banking loan facility).
Check out that interview with Craig Hemke below:
Craig Hemke – Inflation Data Recap, Market Reaction and What Will Carry Through In 2024
As Craig mentioned in the interview, he poses some important questions in this year’s 2024 Macrocast – “Waiting For Jerome.” (the title being a spoof and reference to the French-language play “Waiting on Gadot” popular throughout Europe and North America). While speaking with Craig, on Thursday, I got his permission to share a small segment of his missive with readers here pertinent to the aforementioned discussion in this article.
Waiting For Jerome – A 2024 Macrocast
Craig Hemke – TF Metals Report – January 9, 2024
https://www.tfmetalsreport.com/blog/12437/waiting-jerome-2024-macrocast
[This portion of the above article from Craig he poses some very important questions for investors to consider].
This leads us to the first Big Question of 2024…What happens when that reverse repo balance goes to zero? At its current rate of decline, a zero balance might be seen by late February or March. How will The Fed react? Powell was able to play the hawkish game all through 2023 with his “higher for longer” schtick. But that was only possible because the wheels of liquidity had kept turning. How will Powell respond if those wheels seize up and grind to a halt? It’s pretty easy to talk a good game when your Banks are sitting on $2T in cash but how fast do you change your tune when the funds run dry?
Which leads us to the next Big Question of 2024…Who’s going to buy the debt? The U.S. is looking at a projected NET treasury issuance north of $800B in the first quarter alone. Where the heck is that money going to come from? You could say that reverse repo drain, as well as retail money funds, helped to fund the treasury issuance last year. What about this year?
In the meantime, I don’t expect much upward price progress from the Comex precious metals as the first few weeks of 2024 unfold.
But what about after that? Will The Fed cut in March? If not, how soon will they begin to cut? Will they fall behind the curve and react too late to a faltering economy or will the economy instead achieve the “soft landing” that the political economists keep raving about? That’s another Big Question of 2024. The Fed themselves admit that rate cuts are coming this year as the December Summary of Economic Projections included an expectation of three. Will that be all or will there be five? What if the markets were correct in late December and there ends up being seven?
__________________________________________________________________________________________________________
The Energy Sector: Uranium, Oil, Natural Gas
With regards to the energy sector, as already noted in 2 previous Substack posts shared with subscribers earlier this week, Uranium was really the standout performer. Spot prices had eclipsed $90 and briefly shot into triple digits above $100 per pound. The uranium stocks continued to rip higher with some fantastic gains on the week, and several stocks, like UEC or NexGen Energy closing at all-time highs on Friday.
I’m not going to belabor the points already made in those missives in this article, but will include the link to the special report on the uranium stocks and nuclear energy sector that just posted yesterday.
We’ve Already Seen 10-Baggers And 20-Baggers In Uranium Stocks – Is There More Juice To Squeeze?
Excelsior Prosperity – Shad Marquitz – 01/13/2024
https://excelsiorprosperity.substack.com/p/weve-already-seen-10-baggers-and
With regards to Oil… it really surprised me how muted and rangebound the oil price has been in light of the multiple global geopolitical conflicts underway (Ukraine, Israel/Hamas, US/UN/Yemen), in addition to the challenges to open trade and transportation through the Red Sea. Normally on the back of such much military conflict among major trade routes, key oil producing nations in the Middle East, Eastern Europe, and Asia, and the posturing and ramification from Iran, one would have anticipated more of reaction from the oil market.
It appears that after short-term gyrations, that overall most energy traders have shrugged off the geopolitical conflict and tensions, and focused more on inventory builds, peak US production rates in 2023, and the dichotomy between the production cuts OPEC+ messaged, versus the reality of far more production from nations in this trading block.
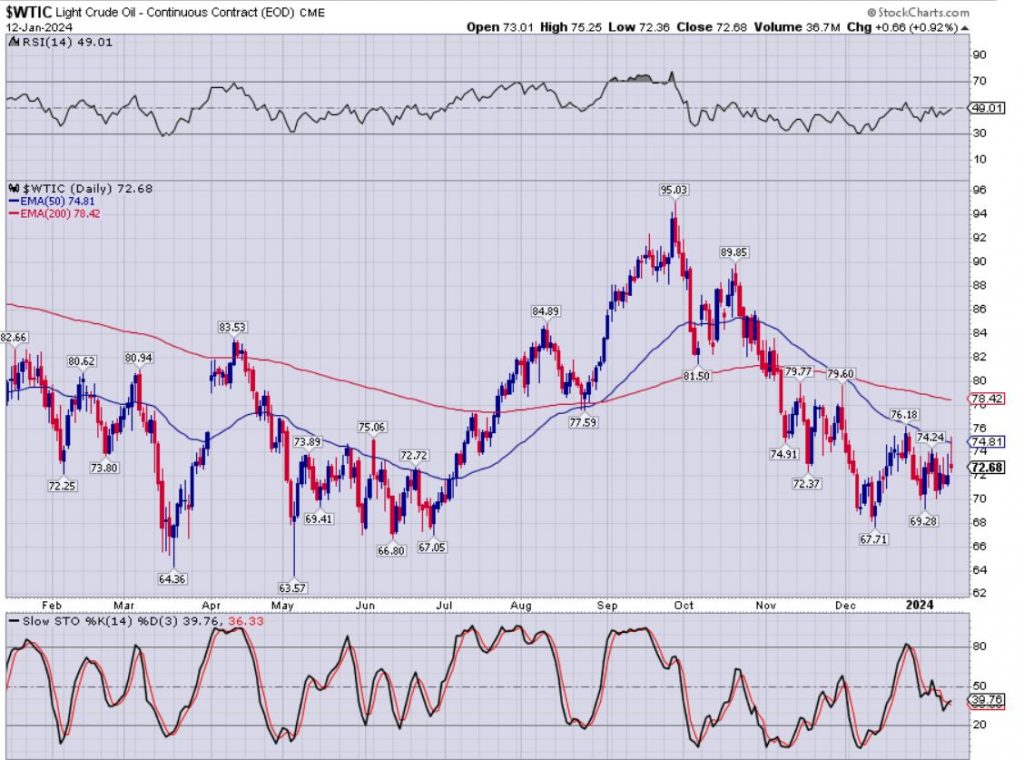
WTI oil closed the week the week at $72.68, right in the middle of the roughly $67-$84 range it’s been in for most of the last year (excluding the temporary run to $95 in September, correcting right back downward in October). On the daily futures price chart one can also observer the neutral posture of the RSI at 49.01 and the 14 day slow stochastics at 39.76 and the 3 day slow stochastic at 36.33.
The 50 day exponential moving average (currently at 74.81) did do a “death cross” down through the 200 day exponential moving average (currently at 78.42) in late November, and so the bias has been and still is to the downside in energy prices. Oil bulls will want to see pricing reclaim and close definitively above the 50 day EMA and more importantly the 200 day EMA to confirm a change in direction and sentiment.
After exiting most oil positions a year ag, I’ve only recently started positions back in 2 oil and gas stocks Baytex Energy (BTE) [light and heavy oils in Canada & US, with some NGLs], Birchcliff Energy (BIR.TO) (BIREF) [natural gas focused in Alberta, Canada]. If we see oil and nat gas correct down further, then there are other names I’ll be adding into my portfolio and writing up in future issues here.

With regards to natural gas: We did have a great discussion and interview with Matt Badiali, Editor of the Mangrove Investor, earlier this week. Matt shares why he thinks prices will remain constrained at generally low prices, and we discussed the higher production rates in the US and how oil production directly impacts natural gas production. We asked about how lower nat gas prices effect the inflation picture, and how other energy prices are impacted by cheaper natural gas. Next we reviewed the potential impact in prices and demand for exportation using LNG terminals to the fragmented global markets. Additionally, as much as we discuss the potential for lower natural gas prices in the US, there still are regional considerations where prices can go much higher in other countries and opportunities abroad.
> Matt Badiali – Will Natural Gas Prices In The US Stay Cheap For The Long Term?
Korelin Economics Report – Jan 9, 2024
Gold, Silver, Precious Metals Stocks:
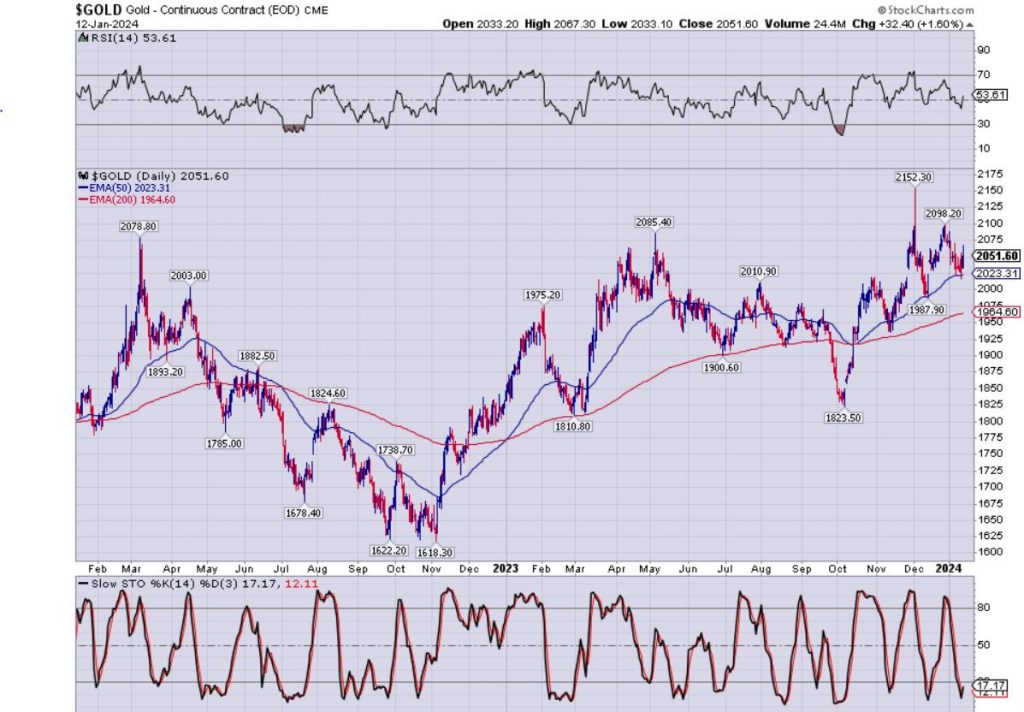
Gold traded in a tight range all week long and closed at $2051.60, slightly below where it opened the week, and thus forming a doji “indecision” candle on the weekly chart. Overall, still a bullish and constructive weekly chart for the yellow metal, with 7 weeks in a row closing over the $2000 psychological level of resistance, and 13 weeks in a row closing over the 200 week moving average (currently at $1958).
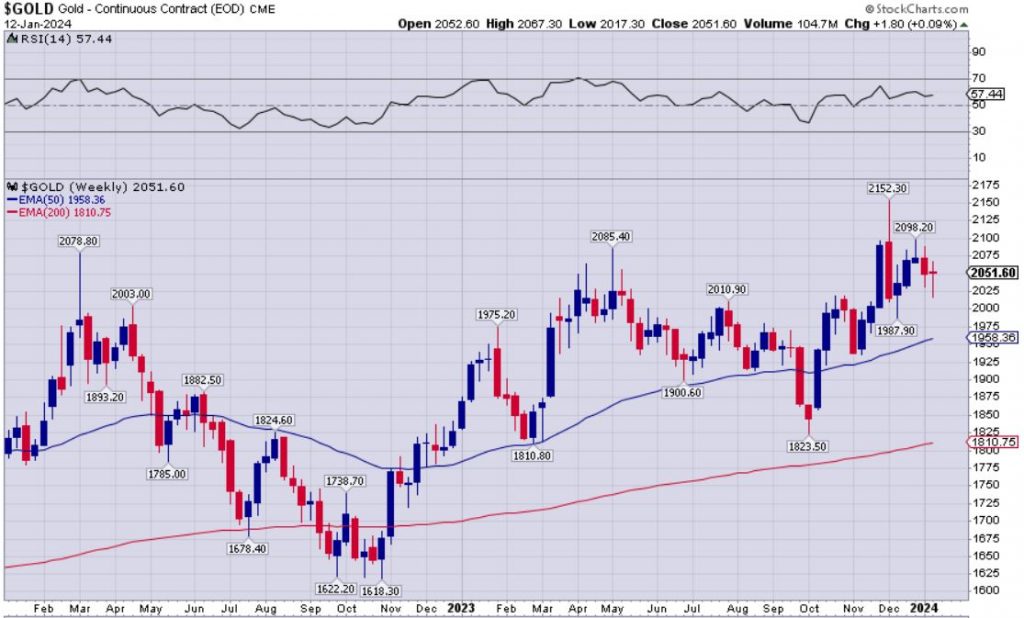
On the daily chart Gold continued to trade and consolidate above the 50 day exponential moving average (currently at $2023.32) and well above the 200 day EMA (currently at $1964.60). For downside support, there is a lot of congestion in the $1980-$1987 price range, if the $2000 level is pierced in any corrective moves in the days or weeks to come, and below that the 200 day EMA at $1964 previously noted.
Silver closed the week at $23.33, just a hair below the 50 week exponential moving average (currently at $23.41), but still well above the 200 week exponential moving average (currently at $22.29). We need to see silver break out of this range to get more action in the PM mining stocks.
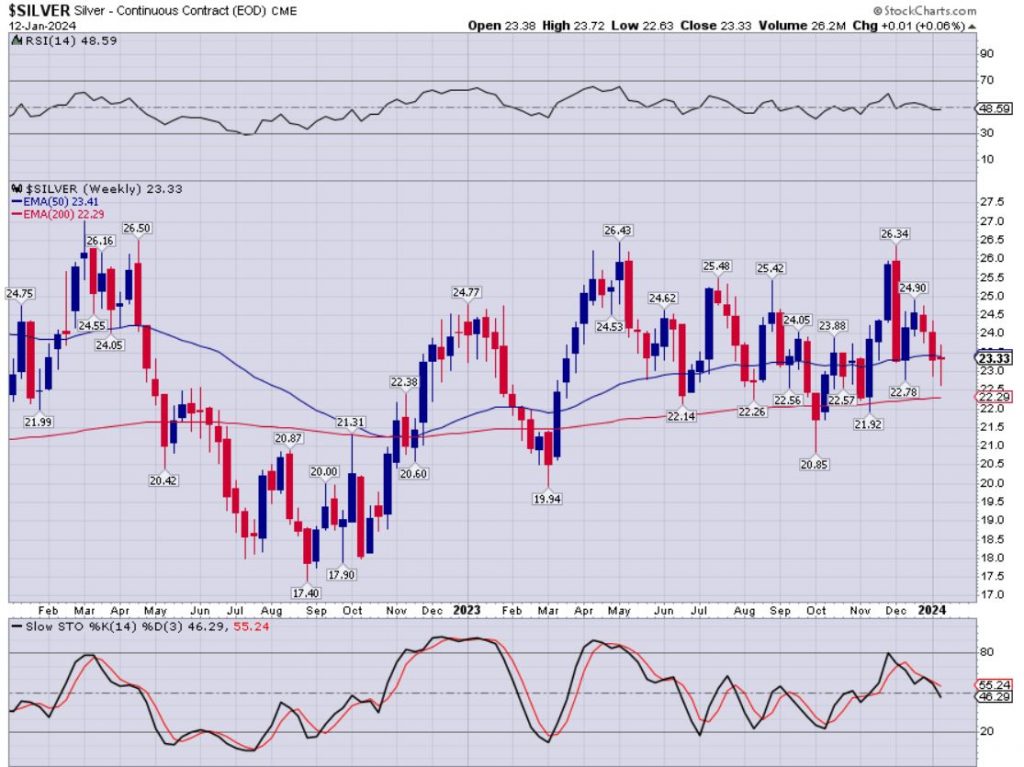
One of our more widely followed interviews over at the KE Report this last week was a conversation I had with my buddy Robert Sinn (aka Goldfinger and CeoTechnician), and in addition to discussing the set up and gold and the gold stocks, we also got into just how sloppy the Silver chart was, and in a sense just a chart depicting channeling sideways between a range of $20-$26 all of 2023, and essentially directionless coming into 2024.
- Here is a link to that interview with Robert, and in addition to the precious metals, we also spent some time in the second half of it getting into his outlook on the red metal, copper, and the divergence between copper producers and the copper junior stocks.
Robert Sinn – Talking Technicals And Fundamentals For Gold, Silver, PM Stocks, Copper, and Copper Stocks With Goldfinger
We also discussed the Copper market with Nick Hodge in a great interview this last week, but I’ve already shared that interview in the last two articles here at Substack. (it can be found on the uranium article linked earlier in this piece). Nick made some good points all year long about the good doctor (Dr Copper) would remain rangebound in 2023 between $3.50-$4.50 and would stay closer to the bottom of range for most of last year. He was spot on with copper prices remaining subdued, despite all the table-pounding bullishness out in the marketplace, and so many commodities talking heads flagging copper as a breakout metal the last few years. Nick’s outlook was that the red metal would not really start to get moving until later in 2024 to 2025, and thus there has not been a rush to get into the copper junior stocks.
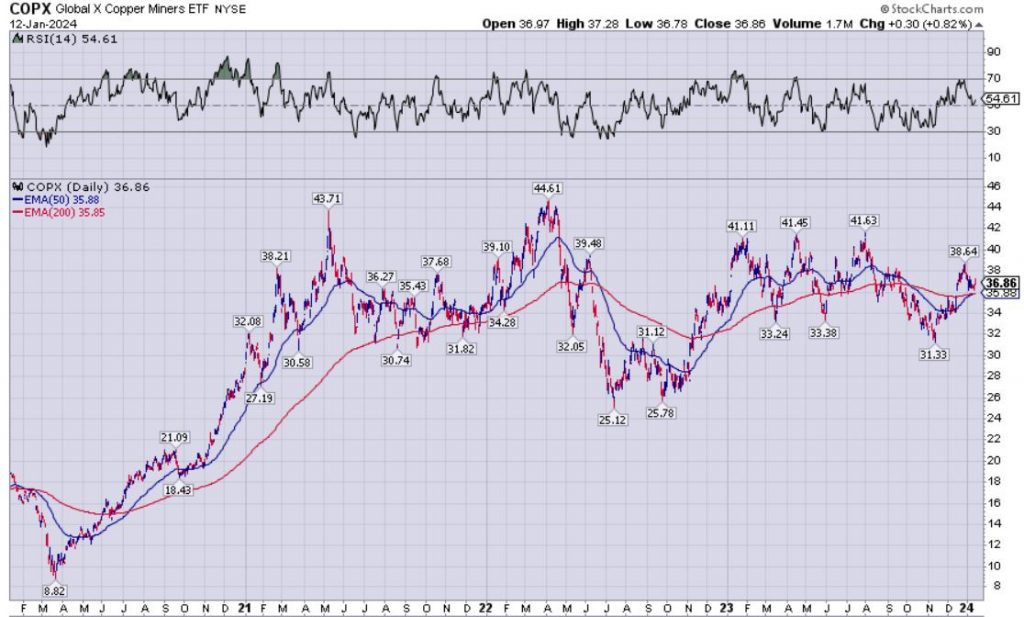
I had pointed out in that discussion with Nick, as well as my discussion with Robert Sinn this week, that overall the copper seniors had remained more robust as a group for the last few years. This is evidenced by the performance of (COPX) Global X Copper Miners ETF, where after the big surge higher coming out of the March 2020 pandemic crash low in most asset classes, COPX surged higher into early 2021 to a peak of $43.71, and then has mostly channeled sideways since then in a range of $30-$41, closing on Friday right in the middle of that range at $36.86.
Just like my pals Robert and Nick, and most resource investors, I too am bullish on copper for the medium to longer-term, for all the fundamental reasons that have been outlined for years on multiple resource and even main-stream interviews, articles, and financial media outlets. Having said that, I still see the risk/reward setup being more constructive for the precious metals over the base metals in the near-term to medium term, and thus have been in no hurry to rebuild most of the copper positions I held into early to mid-2021.
However, as 2024 unfolds, and depending upon what kind of macroeconomic forces unfold in the US, China, and how the supply picture developes out of aging South American mines, then I do plan on starting to scale into some of the more undervalued copper junior equities, and to look for swing-trade or position-trade setups in COPX. I’ll have more to say on copper as we get further into this year, but will be returning to my coverage of some of the growth-oriented gold producers in the special updates in the weeks to come.
Wrapping us up this article, I wanted to share one of the first interviews we recorded last week on Monday with John Rubino; because it was the hands-down most popular discussion we posted from the 2nd week of January. John makes the case for a breakout to new all-time highs in gold during 2024, that will precede a much larger move 3-5 years out. We also discuss how some moderation in inflation and the oil prices may be a tailwind for gold producers, and when paired with higher prices will lead to expanding margins moving forward. We also take a deeper dive into the jobs report numbers from 2 Friday’s ago, and why they should not just be taken at face value based on the headlines.
John Rubino – Gold Price To $5-10K, Energy Outlook Negative, Digging Into The Jobs Data
Thanks for reading this “Week In Review”, and if you’d like to get future articles emailed to your inbox, then come on over and subscribe to my free Substack channel.
https://excelsiorprosperity.substack.com
Ever Upward!
-
Shad
Are Power Shortages In Our Future?
Matt Badiali – The Mangrove Investor – January 11, 2024
“According to a recent article by Jeremy Hsu, the U.S. and Canada could struggle to provide reliable power to more than three hundred million people. He blames “soaring energy demand from the tech industry and electrification of buildings and vehicles.”
He’s not alone. Mark Spurr, legislative director at the International District Energy Associations believes “a massive grid disruption is inevitable.” The risk is from extreme weather conditions, as well as increased demand. It brings us a new opportunity in energy, that we’re really excited about.
“This month, we’re going to jump into the power market. It is one of the most boring, stable sectors of the market. But we’re going to see how that could be ending…”
https://mangroveinvestor.com/are-power-shortages-in-our-future/
Gold is Quietly Building a New Floor at $2000
David Erfle – The Junior Mining Junky – Friday January 12, 2024
https://mailchi.mp/eb32caa9505a/david-erfle-weekly-gold-miner-sector-op-ed-1602473
CMHF 2024 Eric Sprott Tribute Video
CdnMiningHallofFame – Jan 12, 2024
A video tribute to 2024 Canadian Mining Hall of Fame inductee Eric Sprott. #CMHF2024

Uranium Price Jumps To 15-year High As Top Miner Flags Shortfall
Cecilia Jamasmie – Mining.com – January 12, 2024
“Uranium prices jumped on Friday to an almost 15-year high after the world’s largest producer, Kazakhstan’s Kazatomprom (LON: KAP), warned it’s likely to fall short of its output targets over the next two years.”
https://www.mining.com/uranium-jumps-to-15-year-high-as-top-miner-flags-shortfall/