
Overall this last week was fairly volatile in the markets, with plenty of economic data points being hashed and rehashed as to the health of the overall economy. Now here in mid-December, we are plowing forward in this retail-focused holiday season to assess what the actual strength of consumers will be, and preparing for how things will go with Q4 earnings expectations, which will get reported in early 2024.
Even retail giant Macy’s made the news at the end of the week, (with a potential gift from ole’ Saint Nick), as they have received a $5.8 billion buyout offer from real estate investor Arkhouse Management and asset manager Brigade Capital Management. https://www.msn.com/en-us/money/companies/investor-group-launches-58-billion-buyout-bid-for-macy-s/ar-AA1li7RL
Rounding out the last few weeks of this year, it is going to be interesting to see if consumers show up and keep on purchasing, powering the markets into a jubilant “Santa Claus rally” finale to end the year, or if thing tamp down in a more muted fashion and end the retail season with a fizzle.
It’s important to remember that a number of retailers pointed out, when reviewing Q3 earnings season just a few weeks back, that their expectations for a strong year-end quarter were a bit dicey. The jury is still out on how retailers will close up the month, and it may end up being a story of the “haves” and “have nots”.
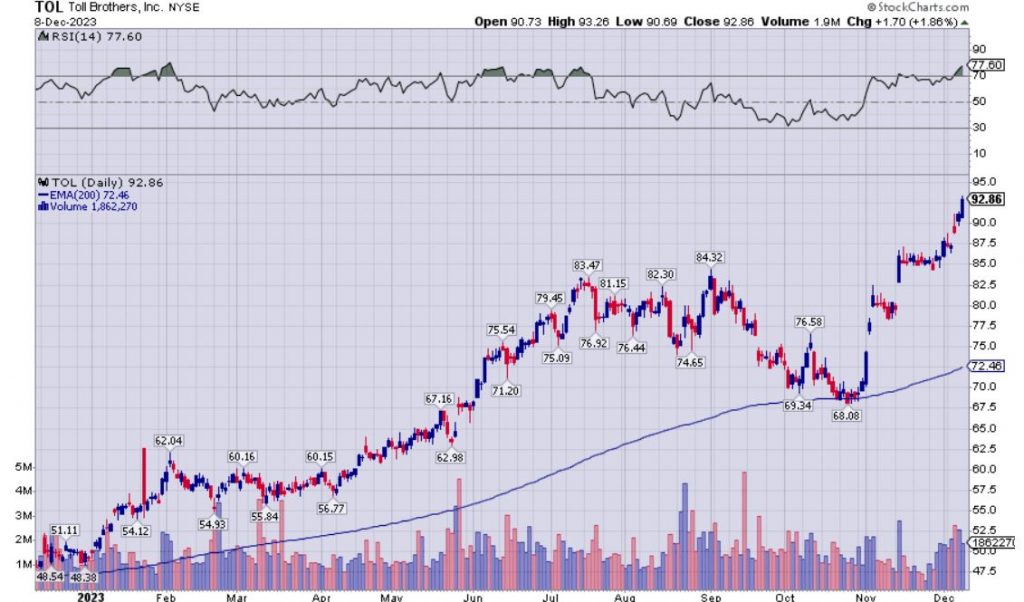
As it relates to the health of the consumer, there are a few conflicting cross-currents with the highest credit-card debt levels seen in over a decade, and lowering family savings rates in bank accounts, but then this can be contrasted with other sectors outperforming market expectations in a big way. High-end home builders Toll Brothers, Inc. (TOL) continues to see buying in the stocks breaking it out to a new high. In their conference call on Friday, CEO Douglas Yearley noted that “Fiscal 2023 and the fourth quarter were terrific for Toll Brothers. Our income and earnings per share for the full year were all-time highs and we ended the year with a 72% increase in fourth quarter signed contracts compared to Q4 2022. We delivered 2,755 homes and generated $2.95 billion in home sales revenues in the fourth quarter, $211 million above the midpoint of our guidance.” This kind of report comes in stark contrast the weakness we see in other home sales data, so again, many mixed signals.

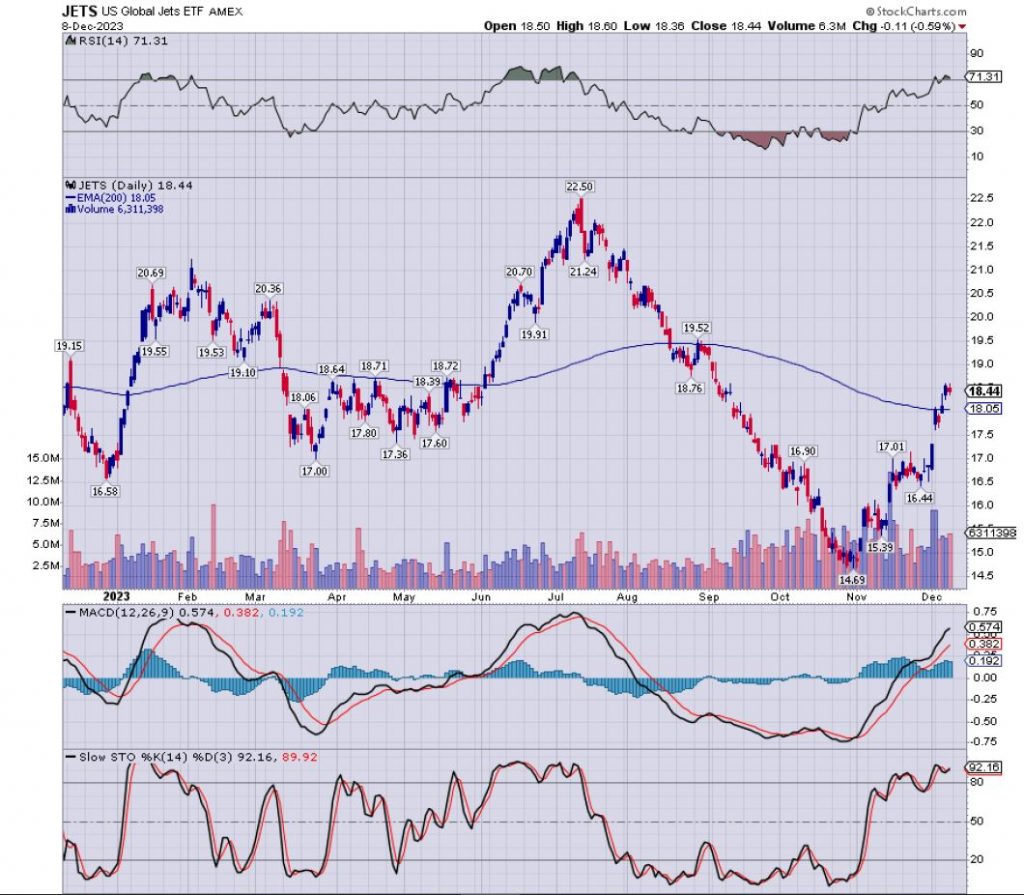
It should also be pointed out that consumers are still spending money on travel, and the airlines and hospitality sectors have performed well the last 2 months, on the back of good earnings. Just take a look at how the US Global Jets ETF (JETS) has been flying high since late October, and blasting back up above it’s 200 day exponential moving average. So money is still being shelled out by consumers, but some commentators have mentioned that buying has been more selective and choiceful.

Towards the end of the week, we saw some pivots in interest rates and the dollar, as they stopped their pullbacks and popped higher, once the markets digested the jobs report data. We’ll need to watch next week very carefully to ascertain if those reversals on Friday are sticky and represent a new trend. It could be that if bonds start selling off again, raising rates back up higher, and if the greenback gains a bit of pricing momentum to the upside, that it could mark the end of the last 2 month cycle higher in most markets coming out of October when rates and the greenback peaked. All eyes will be on those 2 key market inputs, interest rates and the US dollar index level, because they are prime movers across most market sectors and still remain front and center on most investors radar screens, and very key factors in robo-trading algorithms.
Macroeconomic Movers:
Interest Rates:
One of the trends many market participants have been watching keenly all year long has been the steady climb higher in interest rates, that is, up until their peak rates in mid-October. Since then, after the 10-year yield got up over 5% briefly, and the 2-year yield scorched higher to 5.26%, interest rates have rolled over across the board for the last 2 months. After the jobs report data came out on Friday, there was a reversal in their downtrend and they did pop higher, with the 10-year yield closing on Friday at 4.23% and 2-year yield closed the week at 4.72%. Whether or not there will be follow through on that reversal seen on Friday, and a new uptrend in both as we roll into the week to come remains to be seen.
It shouldn’t be understated that the bond yield curve remains stubbornly inverted, with higher rates at the short end of the curve, and the 2-year yield consistently higher than the widely-followed 10-year yield. While this inversion is quite abnormal on a longer-term historical basis, it has become something investors for over a year now have become nonplussed about, and apparently desensitized to as simply the new normal. However, this will come to an end. When the yield curve inevitably does flatten back out and normalizes with higher yields back at the longer end of the curve, then that is often a signal that indicates a recession is more imminently at hand. We clearly haven’t seen that yet, but it will be something to keep our eyes on moving forward.
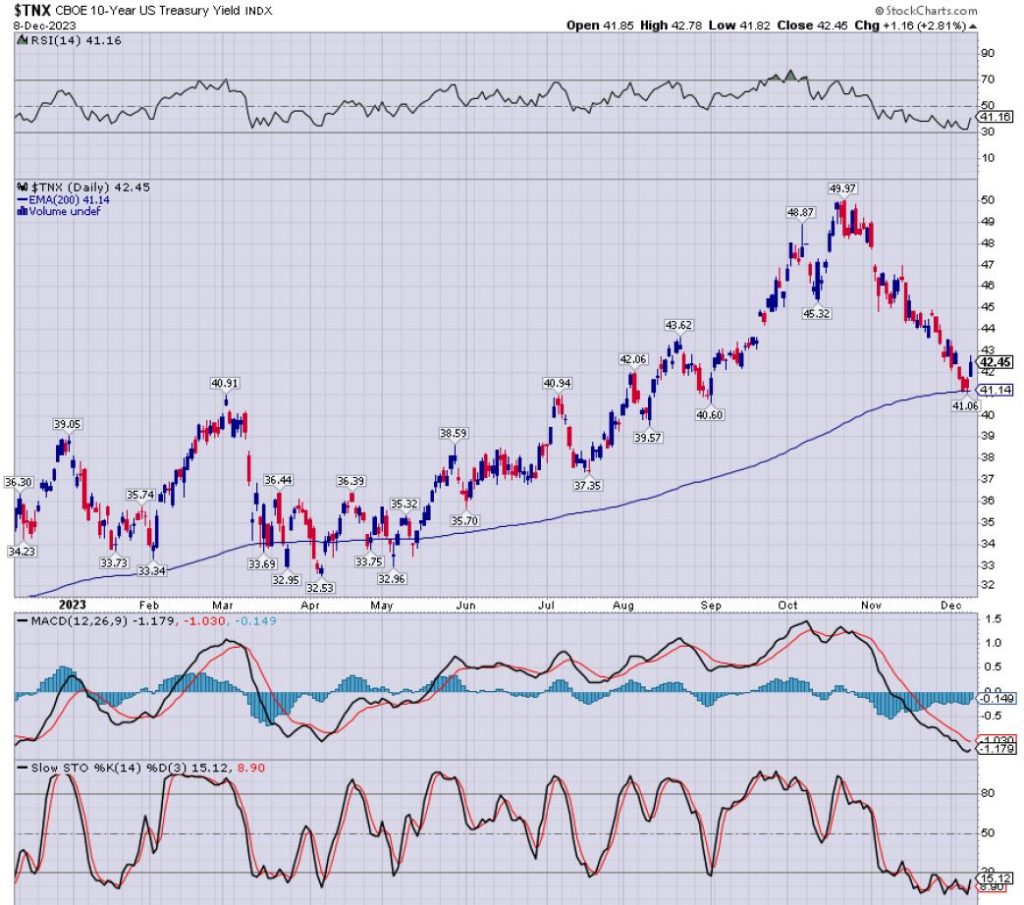
A good way for investors to trade the trends in interest rates is using the (TNX) CBOE US 10-Year Treasury Yield Index. One can see that after a solid year of moving higher, this index topped out near $50 in mid-October along with interest rates, and pulled back down to the 200 day exponential moving average around $41 this last week, before bouncing up higher on Friday to close at $42.45.

Jobs Report and Labor Statistics:
As eluded to earlier, the Nonfarm Payrolls (NFP) data did hit on Friday, with a rise in jobs by 199,000 in November (slightly exceeding expectations for 180,00 jobs), and following the prior increase in October of 150,000 jobs. However, when trying to assess the health of the labor markets, it’s been a mixed bag, because these new jobs reports have continually been paired with revisions lower to prior months reports all year long, and most people are starting to notice. When you balance it all out, the US has created 204,000 jobs on average over the past three months, showing a downward bias and down notably from the stronger 254,000 average pace seen in the prior seven months this year.
We’ve also heard from so many in the financial media and guests we bring on our podcast show at the KE Report, that they are watching the trends in the Unemployment Rate. This NFP report showed a decline down to 3.7% from 3.9% in the same period, which was the highest level seen in nearly 2 years. One potential wildcard would be if we saw the unemployment rate spike up above the psychological 4.0%, in months to come, as that would like trigger a change in sentiment with economists, investors, and likely even the central bankers. There was a rise in the labor force of 532,000 after a decline of 201,000 in the prior month, and the Labor Force Participation Rate ticked up marginally to 62.8% from 62.7%, so that metric is still showing strength.
Fedspectations:
With regards to Fed policy expectations or “Fedspectations”, many investors continue to parse and contrast what Jerome Powell and the other Fed heads say publicly, against with the markets are projecting using the Fed Funds futures data.
If one looks at the CME FedWatch Tool, https://www.cmegroup.com/markets/interest-rates/cme-fedwatch-tool.html, it is clear that markets are not expecting any big changes at the upcoming Fed meeting with 98.4% expecting the Fed rate to remain at 5.25-5.5%, and only 1.6% expecting another rate hike. However, looking out to March of 2024 about 45% of speculators are expecting to see the first rate cut, and by May of next year about 57% are pricing in a cut.
Most other central banks are expected to keep rates steady through year-end, with their first rate cuts also projecting into the first and second quarters of next year.
Checking In On Other Markets:
US Dollar:
After the US Dollar index seemed to double-top in early October and again in early November around the 106.70-107 level, and has been in decline for the last 6 weeks. However, after the DXY got down to 102.50 on November 28th, it has since bounced higher, closing on Friday at 103.62. Many currency traders and technicians noted support at various levels on either side of the 103 level, and that after getting so oversold, it was due for a brief rally. How high the dollar goes will be due to a confluence of factors from technical levels, to patterns in US treasuries, and also global moves in the 6 largest currencies in the basket weighted against the dollar in the index. Again, the greenback remains a key market to follow for investors, as not only the world’s reserve currency, but also a key number in high-frequency trading algos.
General US Equities:
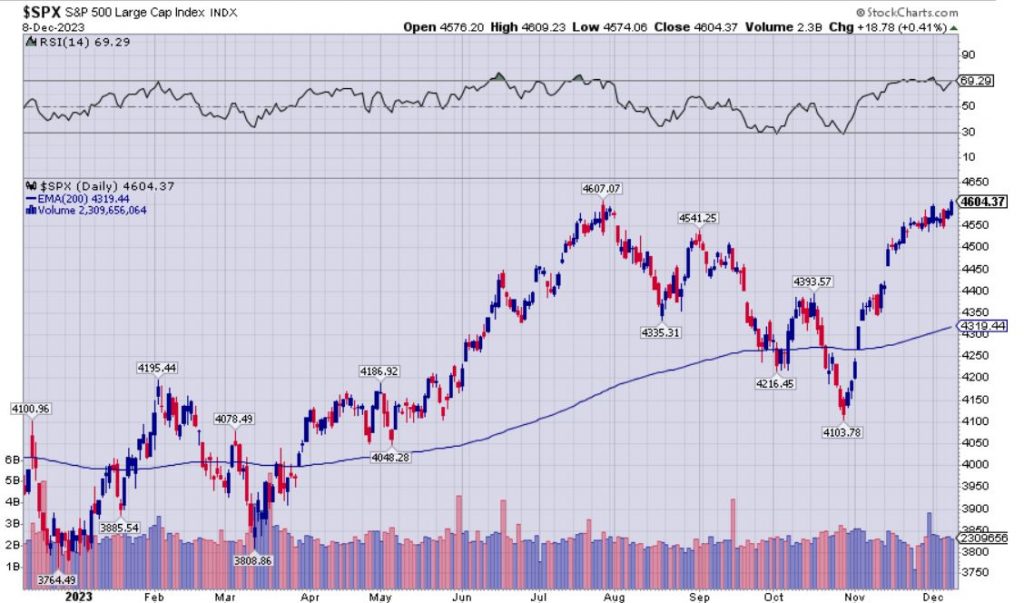
General equities remained well-bid this last week, albeit, mostly channeling sideways with a slight upside bias. The weighted indexes of the S&P 500 and Nasdaq have been on big multi-week runs, coming out of intermediate lows in mid-October, and blasting higher led by mega-cap big tech stocks and the Magnificent 7 leadership. Investors this week will be looking to see follow-through buying to the upside to keep the rally going, with the (SPX) S&P 500 large cap index, closing on Friday at $4604.37, just a few bucks shy of the $4607.07 high from late July. If that high is eclipsed meaningfully it could portend to a solid Santa Claus rally in the US equity markets, but there is also the danger of higher rates and a higher dollar causing markets to double-top around their July highs, so it will be interesting to see how this next week closes.

Commodities:
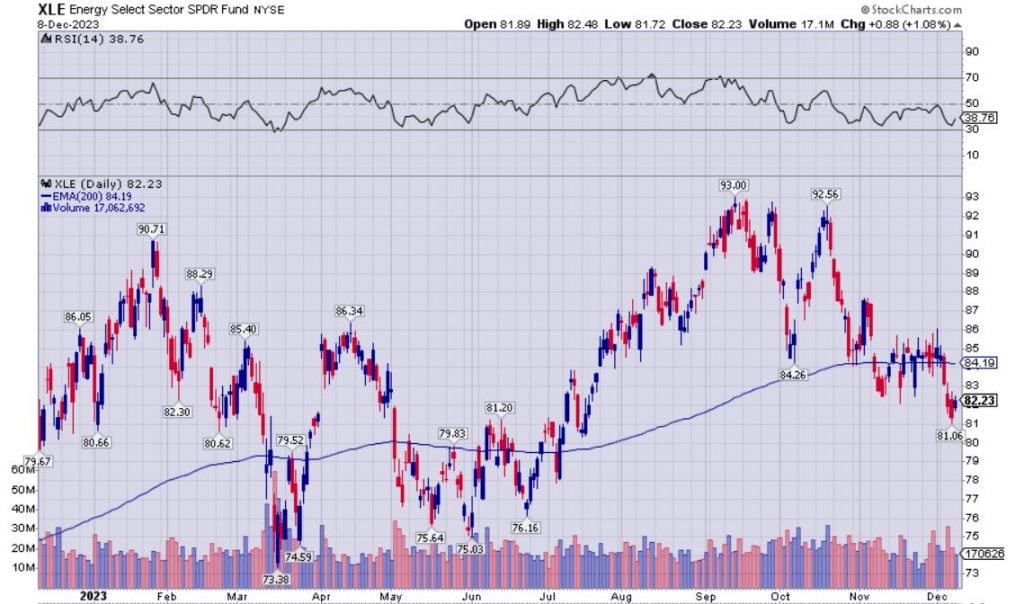
Oil and energy stocks continued to be under pressure again last week, with WTI dipping down below $70 into the high $60s on both Wednesday December 6th and Thursday December 7th, and closing the week back above $71. The key energy stocks EFT (XLE) Energy Select Sector SPDR Fund has remained under pressure for most of Q4, after having a very nice move higher in Q3. (XLE) double-topped at $93 in September, and again at $92.56 in October, and has pulled back well below the 200 day EMA (currently at $84.19), dipping down to $81.06, and closing the week at $82.23.
Most of the analysts we’ve brought onto the KE Report still see oil and the energy stocks remaining under pressure in the near to medium term, but it’s a market that is also presenting very compelling opportunities in many individual oil stocks. Later this next week, I may put up a short article on my Substack page highlighting some oil & gas stocks that have my attention at present, considering the selloff we’ve seen in the sector.

Copper has continued to trudge along in a sideways range, and aside from a few nice moves higher well above $4 at the beginning of the year, the red metal has been basically stuck between $3.50 – $4.00 most of the rest of this year. Since “Doctor Copper” is seen as a barometer for economic growth, it’s muted moves and inability to break out may signal some investors concerns about the strength of not just the US but also the global the economy and potential worries of a recessions in many nations heading into next year.
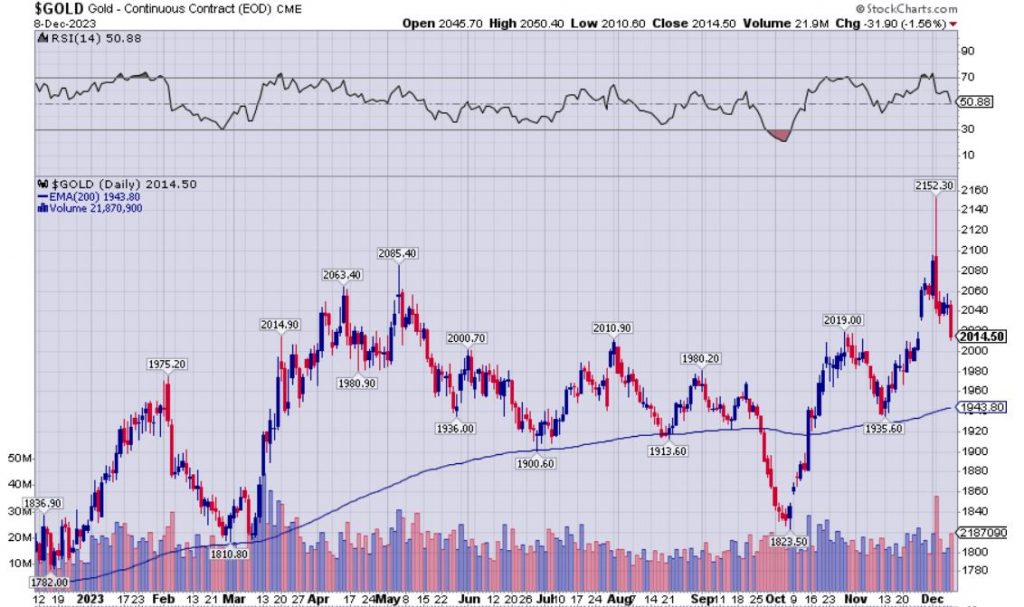
Gold, after putting in an all-time monthly, weekly, and daily highs on the charts in the prior week, was whipsawed Sunday evening in overseas trading from up to an all-time high of $2152, to drop over $100 at the beginning of the week, and continue trekking lower throughout the balance of last week to close at $2014. This foiled a solid advance in the prior 3 weeks, and roiled the gold equities during the week, flipping on it’s head the more constructive sentiment with precious metals investors, to end the week in more of a sour sentiment environment.

We’ve talked to a lot of different thought leaders about what has held the price of gold up higher in the face of some tough market conditions, and then what caused it to just breakout to new highs on the monthly, weekly, and daily charts. One area most commentators agreed on was that move higher that channeled sideways the last 3 years was due to large purchases by global central banks. Last year in 2022, central banks made record purchases of gold and continued to be strong buyers throughout 2023. Chinese and Indian investors have showed strong buying in the East and this may have also underpinned some of the recent price strength. More recently, the geopolitical conflict in the Middle East, and market expectations around when the Fed will eventually cut rates next year has given the yellow metal a further bid.
When asking different thought leaders in the precious metals on our podcast show what would cause gold and the PM mining stocks to really break out next year, there was an answer from one guest in particular last week that really stood out in my mind as far as addressing this topic. Nick Hodge, co-owner of Digest Publishing, gave a nuanced answer that essentially stated that while geopolitical flare ups, and moves down in interest rates and the dollar can and have been a factor, it will be the realization from more generalist investors that the economic picture is not as rosy as being covered in the mainstream financial media, and that as more cracks show up under the surface of the economy in weakening data, that there will be a larger flight to safety in gold and the precious metals sector that will propel it to new all-time highs again next year.
- Here is the link to that interview with Nick Hodge from last week:
Another great point that friend of the show, John Rubino, made about the larger technical outlook for gold, is that former resistance levels around $2000 may now offer a form of buying support moving forward. John stated in a recent Substack article, “One of the fun things about bull markets is watching resistance levels turn into support. Gold, for instance, spent three years banging into $2000/oz and recently broke through, touching $2125 on December 1. If the ‘$2000 is now support’ thesis holds, buyers will enter at this level and stop the carnage. If not, then gold is still rangebound, the past week was just a head fake, and the battle for $2000 continues.”
Hunting for growth-oriented precious metals producers for this next bull cycle:
A number of folks email or message me asking what stocks I like for the coming bull market. In my trading account that is focused on resource stocks, I have a balanced portfolio across a number of commodities because not all commodities run at the same time. Having said that, at this particular point in commodities, my portfolio is now very heavily overweighted to the precious metals sector; because of the opportunity for outsized gains with gold and silver stocks, that I personally anticipate over the next 1-2 years.
Within a specific commodity, like gold stocks, I also diversify across different stages of mining stocks, from royalty companies, to producers, to developers, and to advanced explorers (I don’t personally hold very many earlier-stage pre-discovery drill plays). Of those different stages of mining stocks, my portfolio is most heavily weighted towards the PM royalty companies and mid-tier to smaller growth-oriented producers. I wrote last week about some other positions held in the optionality “beta” plays that have traditionally had higher torque to rising prices. However, my highest conviction plays tend to be revenue generating companies that can monetize higher metals prices through production, and expanding margins, but that also have plans internally to substantially grow production through organic development and exploration on their existing projects.
On Thursday of this last week, one of companies I interviewed was I-80 Gold Corp (IAUX) (IAU.TO), and from my perspective they fall into this “growth-oriented producer” category quite well. For full disclosure, (IAUX) is a position that I hold in my personal portfolio, with the thesis being to capitalize on their projected growth over the next 3 years. (Obviously, this is not investing advice and people should do their own due diligence).
What catches my attention personally with I-80 Gold, is that next year they plan on growing production from their Granite Creek mine, once they access the recently discovered South Pacific Zone in their mining sequence in 2024, while they keep working on developing their Ruby Hill mine, and Cove Mine projects. The larger plan, CEO Ewan Downie shared with me in that interview is that they eventually plan to get to the point where they can bring all 3 gold deposits into production at their Lone Tree Processing center in about 2-3 years. This in concert with their proposed conversion of the Ruby Hill processing center into a base metals plant to produce concentrates from their CRD style polymetallic deposits at Hilltop and their FAD deposit, along with the skarn style polymetallic deposit at Blackjack, should give them a multi-fold increase in production by 2026. The Company has announced an agreement with a potential larger partner company that will bring in a big part of the needed capital to fund the interim development of the Ruby Hill project, if/when the transaction closes in mid-2024.
Additionally, the company has a steady string of news to release to the market over the next few quarters including an initial maiden resource estimate on the polymetallic projects, and updated drill results from a number of the gold and base metals exploration targets, as well as some first pass economics on some of the deposits. It is their potential to ramp up production several multiples higher over the next 3 years, while also expanding resources through the drill bit and aggressive exploration, that has me animated by (IAUX). Whether or not this particular company is of interest to anyone reading, isn’t as important as the concept of looking at other producing gold or silver companies through the lens of how can they grow their production profiles. A key question to consider for each company is what development and exploration “alpha” do they have in store that may be underappreciated by the marketplace, regardless of the moves in the underlying metals prices?
- Here is a link to this last week’s interview with Ewan Downie, CEO of I-80 Gold:
A Focus On The Uranium Sector
One other commodity in the energy sector, that has had a great year in 2023 has been the uranium sector. This last week I was joined by Justin Huhn, Founder and Publisher of the Uranium Insider, for a really wide-ranging discussion, where he provided a comprehensive macro update on the uranium and nuclear fuel sector. After having seen the u308 prices surge to over $80 per pound this year, we also saw solid accompanying moves higher in many of the more established uranium mining stocks.
On the demand side of the market, we continue to see big commitments to increasing the nuclear energy build out from many countries coming out of the ongoing COP 28 conference, and we note many surprising countries, like Sweden, South Africa, Ghana, Egypt, Morroco, and Uganda making commitments to build new reactors. Additionally, we have seen both lifetime extensions on existing plants in the west, and Chinese reactor builds in the east that continue to be key demand drivers in nuclear energy and the uranium fundamentals. With regards to the contracting cycle and term pricing, we have seen more transactions over the last year which demonstrates that the larger players are getting into position for a more active phase of the uranium pricing cycle.
In the interview with Justin, we both discussed the supply side of the sector, and the increased interest in companies that can readily produce uranium. This is mostly isolated to a few of the largest companies like Cameco (CCJ) (CCO), Orano, and Kazatomprom, and then some of the smaller US-based ISR producers like Energy Fuels (UUUU) (EFR), enCore Energy (EU) (ENCUF), Ur-Energy (URE) (URG), Peninsula Energy (PEN.AX) (PENMF), and Uranium Energy Corp (UEC). Justin discusses the size of some of the new reactors being built and the initial fuel load many will need that is 2-3 times the normal operating fuel, and there just won’t be enough supply coming online to fuel all the 62 reactors under construction and the existing 436 global reactors, without some larger projects coming online.
We discussed the significance of the NexGen Energy’s (NXE) Arrow deposit, the Phoenix Project from Denison Mines (DML) (DNN), and Global Atomic’s (GLO) (GLATF) Dasa Project as key larger projects that will need to come online to feed the growing demand, but noted that they are still years away from production coming online. This creates a very interesting supply/demand mismatch over the next 5 year window of time, and Justin unpacks how this will continue to underpin pricing for the medium to longer-term, as well as continued interest in the uranium stocks from investors.
- Here is a link to that interview with Justin Huhn on the Uranium and Nuclear fuel fundamentals:
Wrapping up, it was a wild and wooly week in the markets last week, and in particular focus was the volatility and potential change in direction of interest rates and the US dollar on Friday, and the potential for intermediate-term reversals in a number of sectors if these trends reassert themselves this next week and in weeks to come.
We’ll be looking forward in the week to come to the CPI inflation reading on Tuesday, and the much anticipated Fed meeting on December 12-13, and comments by Jerome Powell in the press conference afterwards. Most market participants are not expecting any fireworks out the Fed, and expect them to keep rates stable at the 5.25-5.5% level again until the next meeting. However, as is always the case, the financial media will be parsing every word for any key changes in tone, and dissecting their latest “dot plot” chart of where they expect potential rate cuts and the direction of the economy looking into next year.
May your week in trading and in life be very prosperous, and if you haven’t subscribed to my substack page, please come over and do so as I’ll be periodically throwing out 1-2 other shorter articles mid-week as things come up.
https://excelsiorprosperity.substack.com/
Thanks for reading and Ever Upward!
- Shad