Big Ridge Gold – Another Tranche Of Drill Results From The Hope Brooke Gold Project
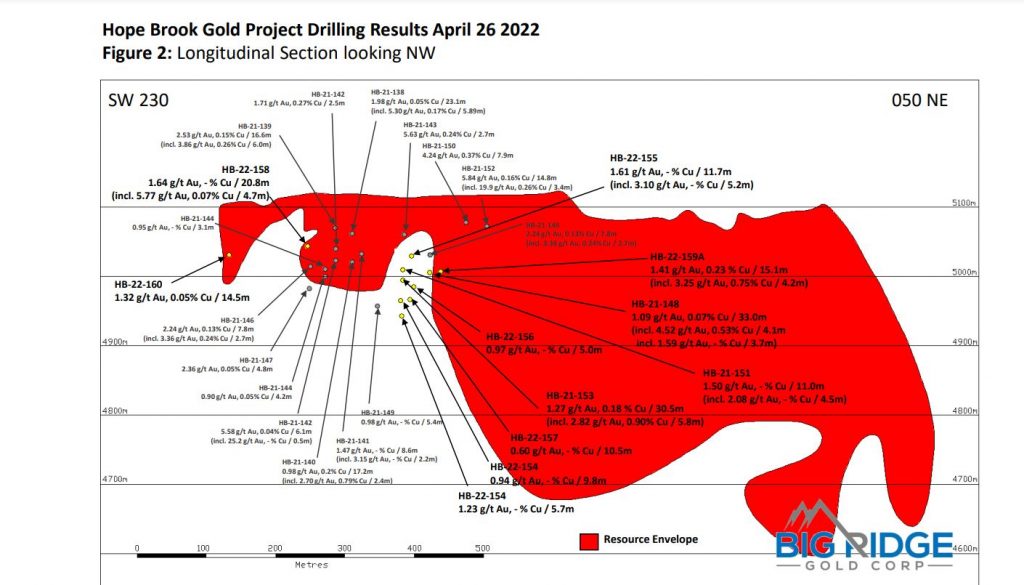
Mike Bandrowski, President and CEO of Big Ridge Gold (TSX.V:BRAU – OTCQB:ALVLF) joins us to recap the next tranche of 10 drill results, released April 26th, at the Hope Brooke Gold Project in Newfoundland. 23 holes have been released so far out of the 50 holes that have been drilled, so far from the Phase 1, 25,000 meter drill program, with all of the holes intersecting gold mineralization.
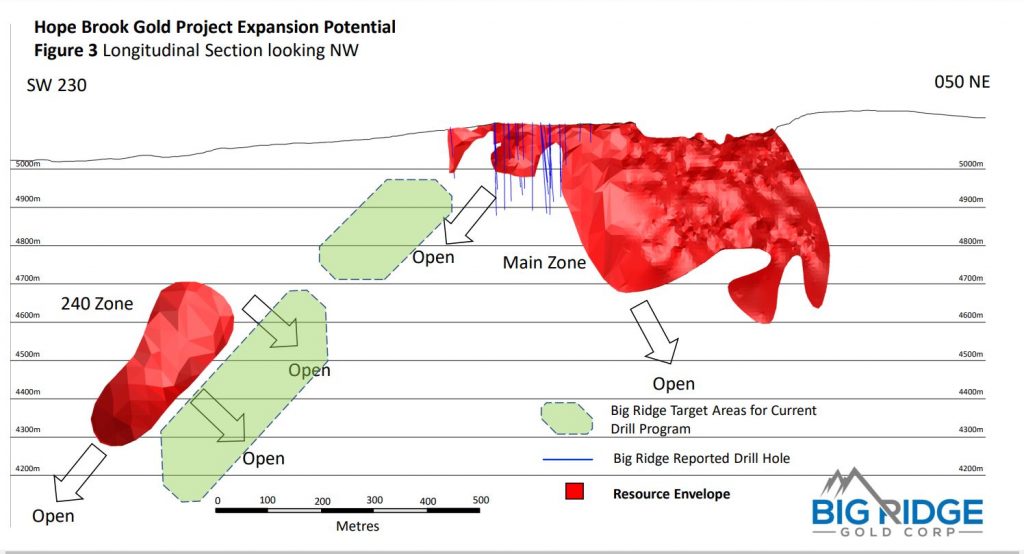
We have Mike outline where the drilling has been focused so far at the Main Zone and 240 Zone as it moves to the southwest and at depth to possibly connect these two resource areas. There will also be drilling at depth under the Main Zone and 240 Zone, and then finally some shallow drilling in the NorthEast Extension Zone which is currently undrilled, but shows promise on the geophysics work completed thus far.
The Hope Brooke Project already has nearly 1million ounces of gold in a resource with the goal of continuing to grow the total ounces and update the resource estimate the beginning of next year, and then start working on a economic study to highlight the viability of the deposit. The study has not been updated since 2012, and that was at much lower gold prices, and it didn’t account for the copper found in about 70% of the holes, which should be a key co-credit.
If you have any follow up questions for Mike regarding the drill program please email us at Fleck@kereport.com and Shad@kereport.com.


DT – Good response and summary on Big Ridge Gold.
Yes, Newfoundland is still a hot exploration area, but unlike most of the explorers operating there, Big Ridge has near 1 million ounces aleady and the team is growing it further with this phase 1 drill program.
While they are still finding narrow high-grade veins which is par for the course in Newfoundland, but as Mike pointed out, they also have a lot of disseminated gold halo material that is lower grade but still quite amenable to economic mining. First we’ll need to see where the resource comes in for H1 2023 after all this ongoing drilling, but then after that can set sights on what parts are going to be economic.
I didn’t realize until this interview that they were also finding copper in a number of holes as well, so that’s a nice kicker as well.
Gold is virtually guaranteed to come down and touch its 50 WMA/200dma at $1835 soon (sometime in the next two weeks would be my guess) and will likely dip below that level at least intraweek to really rattle longs. I would call $1820ish decent support, but intraweek you never know how low they can and will take it.
For silver, it’s quite possible it will hit its lower weekly BB, currently at $21.56 (which also happens to more or less be the 600WMA). But my cynical guess would be that if it does hit that level, it is eventually headed for its 200 WMA at $20.33. Worst case for me would be $18.44, which is the 400 WMA.
Your call is very reasonable in line with myself as well as Gary. Today if we take a close look it smells like a false daily breakout and I would count 7/8 days before the best opportunity and higher percentage chance we have bottomed and lift off. If we count today as day 1 we add 6/7 days more we are looking at a timeline of next Tuesday/Wednesday as a good percentage odd. Which goes in line with what I have stated these pass few weeks and days.
If we take a look at the higher time frames the monthly candle in hui, xau, gdx have all come down or are very close to the important 10 day moving average. I mentioned this and stated that’s were the bulls will and should stop this. I can’t guarantee anything but we can either get a red hanging man candle in the above or a slightly lower red candle with an evident sized wick. Either way odds to favor a weekly swing next week.
The faster we get this over with and very soon the miners will be in there way and as Matthew mentioned the next time impact or anybjthrr miner moves up it won’t be to come back down it will attack 70 in short order..
Glen
When the XAU’s weekly MACD turns down, there is hardly any instance in the last 30 years where waiting until the MACD MAs hit the zero line wasn’t the wise move.
Even instances where there is a fakeout crossover of MACD moving averages and the weekly MACD continues higher for some time, by the time the MACD corrects back to the zero line, price is almost always lower than during the fakeout. It’s actually pretty sad to be honest (it hardly ever does what the US stock indexes do, which is to actually keep price elevated as the MACD corrects back to the zero line).
In sum, it is best to sell the miners at any whiff of a loss of momentum per the weekly MACD (which we have now) and buy back once the MACD MAs cross or at least touch the zero line.
Even in late 2019, where it looked like it might buck that pattern, we ended up getting the March 2020 crash, which took the weekly MACD back below the zero line very quickly and prices well below where they were when the MACD first indicated a loss of momentum in the early fall of ’19.
I hear what your saying but I’m a longer term investor and I’m looking at the higher time frame meaning the quarterly and monthly. But even if we take your scenario in regards to the macd and pointing in a downward angle which by the way has crossed over as I type, it’s projectors is exactly what I have been discussing here for sometime and more importantly today which is one of 1830-1850 more so on the lower number and would send miners some change down. I’m not here and I would never advise to sell at this current moment unless your a genius of a trader with all due respect. What I would 100% advise is be a buyer here and into next week if that’s the case. You don’t sell fear you buy it.
Macd will move in the weekly to the Zero line possibly into negative territory but it will be swift and turn and more so in line with all the monthly parameters including the ten day moving average on hui xau gdx and so forth and so on. Could dip slightly below it but by any means I don’t see the monthly going towards the 200 day nor the weekly breaking immensely through the 50 day I believe it will hold give or take but stand it’s ground. No prediction but a very confident probability
Glen
Silver and gold’s weekly chart formations and weekly MACDs look eerily similar to 2011-2013. The banksters would obviously love for things to play out the same way. This should be fun.
Big Ridge has held up well, I hope I don’t jinx it…
Hi Dan, Big Ridge will be the first company to go into production of all the newer companies that have been drilling successfully in Newfoundland and that includes New Found Gold. I believe their timeline is one year from now for their first pour. DT
XAU:gold ratio chart is stuck between the declining 600 WMA and rising 200 WMA.
The picture does not look to disimilar to the situation in 2008 when there was a failure of the 200 WMA to positively cross above the 600 WMA.
If the current trajectory of those MAs remains the same as now, the 200 will positively cross the 600 WMA sometime around March 2023. I’m pretty sure the banksters will have lots of fun with this sector between now and then. Get ready for headfakes and whipsaws galore for the next year IMO, because there is very little chance the XAU:gold chart makes a definitive break above the 600 WMA before then.
The picture today is hardly similar to that of 2008 aside from the fact that the 200 MA has not crossed above the 600 MA. In 2008, the 200-600 bear cross was only 8 years old, today it is 22 years old. Between 2000 and 2008, the 200 MA was no more than 19-20% below the 600 which is about 40% of the difference between the two in late 2016/early 2017. To look at the picture without regard for cycles is a huge mistake and the big cycle that was still young in 2008 is now over. Last but not least, the 200 week MA has acted as support for the last 106 weeks and there hasn’t been one weekly close below it during that time. The last time that MA acted as support for that length of time was in the early to mid 1990s and the last time we saw so many weeks without one weekly close below that MA was… never.
Looking at the more important quarterly chart, the differences get bigger and better. The 36 quarter (roughly 9 year) MA is now rising for the first time in 25 years and this quarter will deliver the 9th straight close above that MA. Between Q2 2006 and Q2 2020, there was just one close above that MA: Q3 2007. You’d have to go back to the mid 1990s to find the last 9 straight quarterly closes above that MA. In fact, you’d have to go back to the mid 1990s to find even 5 straight such closes.
When the quarterly MACD finally gets above zero again, it will be the first time since Q2 1993.
https://stockcharts.com/h-sc/ui?s=%24XAU%3A%24GOLD&p=Q&yr=45&mn=0&dy=0&id=p56791478065&a=1143018807&r=1651613091595&cmd=print
Though more dramatic, this setup looks similar to May/June 2020. We just need strength into Friday’s close followed by more strength next week to help that possibility.
https://stockcharts.com/h-sc/ui?s=%24XAU%3A%24GOLD&p=W&yr=5&mn=0&dy=0&id=p31395422314&a=1157132926
Gold:HUI is getting ready to resume its fall (which means the miners are getting ready to resume their outperformance of gold).
https://stockcharts.com/h-sc/ui?s=%24GOLD%3A%24HUI&p=D&yr=1&mn=10&dy=0&id=p50618970051&a=1070237347

What’s not to like, 10 million in the bank, a past producer with mine ready to ramp up, one million ounces of gold, exploration can expand this deposit, and it’s in one of the hottest areas for gold exploration worldwide, Newfoundland. It is also on a gold fault line that runs from Newfoundland to Ireland, just ask any Irish Newfoundlander. I also like the fact that Michael Gentile is already a shareholder. DT