A look into the supply of Oil around the world
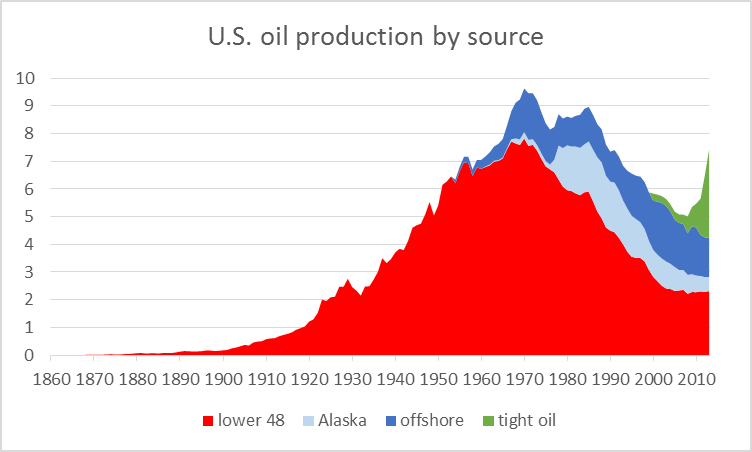
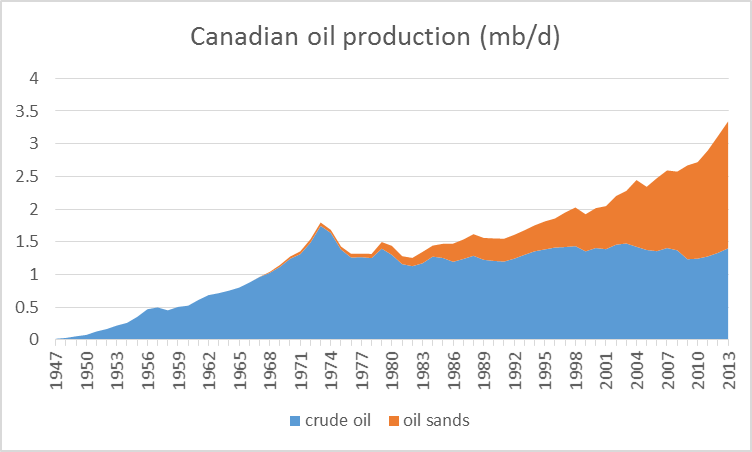
Here is another opinion on the declining price of oil. What I found interesting is the supply statistics. While it’s not surprising that supply has been rising check out the charts below to see just how much it has been growing.
First the US oil production.

Now oil production in Canada.

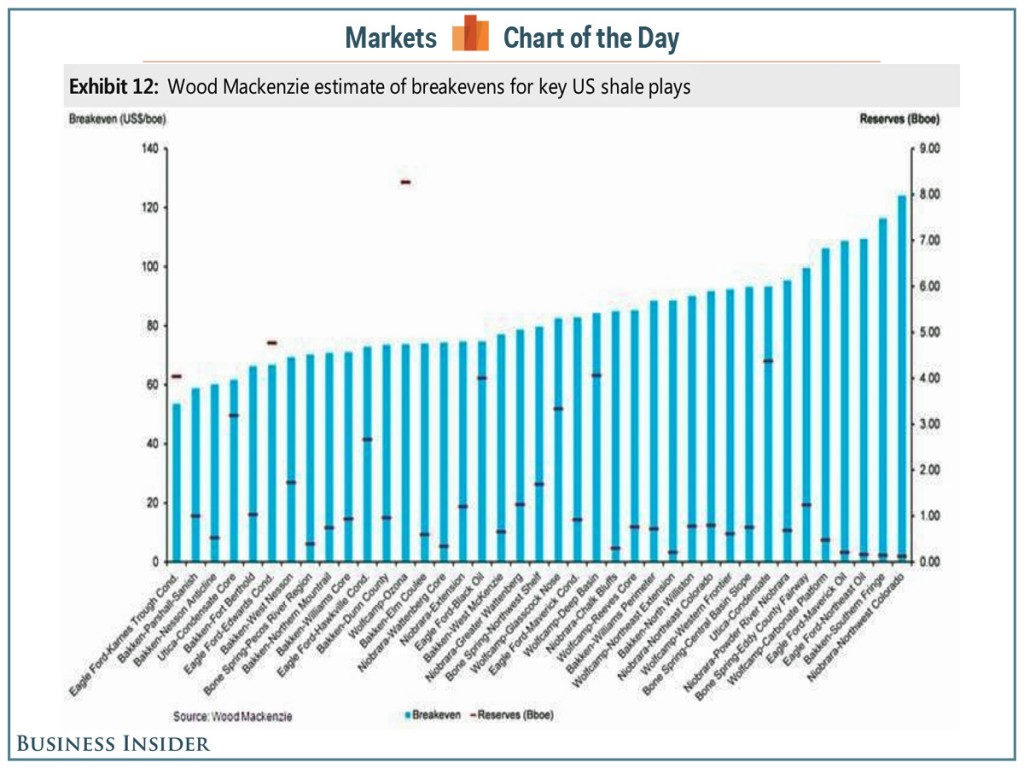
The most interesting chart in the post has to be this breakeven price per barrel for US shale oil plays courtesy of the Business Insider. |There are very few companies that can survive with an oil price at $60. Not a good sign for the shale industry in the US…

Since a bailout for distressed shale companies loaded with debt is probably out of the question, Saudi will be buyers….will end up owning the US oil boom. This is not hurting Russia at all, since they are not trading in dollar terms anymore. The devalued Ruble will only help exports. Russia is also second only to China in it’s Gold purchases. They are hedged to the hilt because they’ve long discerned the machinations of Western Banking powers.
Russia cut? Yeah right!

Saudis say they will not give up market share. Want US and Russia to cut.
http://www.telegraph.co.uk/finance/newsbysector/energy/oilandgas/11268611/OPEC-Saudi-Prince-says-Riyadh-wont-cut-oil-unless-others-follow.html